| Key Features | BetterUptime | Palzin Monitor |
|---|---|---|
|
Service Integration Monitoring (50+ 3rd Party Service Monitoring)
Service Integration Monitoring: Monitor over 50 third-party services to ensure their proper functioning.
|
- | |
|
Application Performance Monitoring
Application Performance Monitoring: Keep track of the performance metrics and behavior of your applications.
|
- | |
|
Error Monitoring
Error Monitoring: Identify and track errors occurring within your system for effective troubleshooting and resolution.
|
- | |
|
Free custom subdomain (status.yourdomain.com)
Free custom subdomain: You can have a subdomain dedicated to displaying the status of your service or website (e.g., status.yourdomain.com).
|
- | |
|
War rooms (Google Meet and Zoom)
War rooms, also referred to as Situation Rooms, provide a platform for enhanced transparency by bringing all responders together on a single conference call automatically. These dedicated spaces are commonly utilized for incident resolution meetings, commonly known as War rooms
|
- | |
|
Reliability
Reliability: Ensuring dependable and consistent performance.
|
||
|
Beautiful dashboard
Beautiful dashboard: Enjoy a visually appealing and user-friendly dashboard for easy monitoring and management.
|
- | |
|
Designed for Team & Enterprise
Designed for Team & Enterprise: Specifically designed to cater to the needs of teams and enterprise-level organizations.
|
From high-growth startups to Fortune 500 companies, engineers choose Palzin Monitor.
Stay informed about your website's status with our reliable monitoring service. Receive alerts before any significant issues occur, helping you avoid downtime and save money.
Don't lose visitors due to expired SSL certificates. With our SSL monitoring service, you'll receive notifications 30, 14, and 7 days before expiration, giving you ample time to renew your certificates and maintain your website's security.
Check the availability of network devices with ease using our Ping monitoring service. It's one of the most widely used tools by administrators to ensure the smooth operation of network infrastructure.
Keep track of critical services running on any port with our Port Monitoring service. Monitor email and database servers, or any other specific services that are essential for your business operations.
Make your day-to-day administrative tasks easier with our Heartbeat Monitoring (also known as Cronjob monitoring) service. Keep track of intranet devices and ensure their uninterrupted connectivity, even if they're connected to the internet.
Use our Keyword Monitoring service to check the presence or absence of specific text in the response body of requests, typically in HTML or JSON format. Stay informed about your website's content and performance with ease.
Scope your internal services from your architecture and monitor your 3rd party services with our Service Monitoring service. Stay informed about your services' health and maintain your business continuity without any interruptions.
Prevent domain losses and outages with our Domain Expiration Monitoring service. Receive warnings before any of your domains expire and take timely action to ensure their continuity.
Receive alerts whenever your domain's nameservers unexpectedly change with our Nameservers Change Monitor service. Stay informed about any unauthorized or unexpected changes and take necessary actions to secure your domain.


Palzin Monitor integrates seamlessly with tools like DataDog, New Relic, Grafana, Prometheus, Zabbix, Microsoft Azure, AWS & Google Cloud, making it easy to consolidate all your monitoring tools in one place.

Receive instant alerts via phone call, SMS, Slack, Microsoft Team and email before your customers notice any incidents.
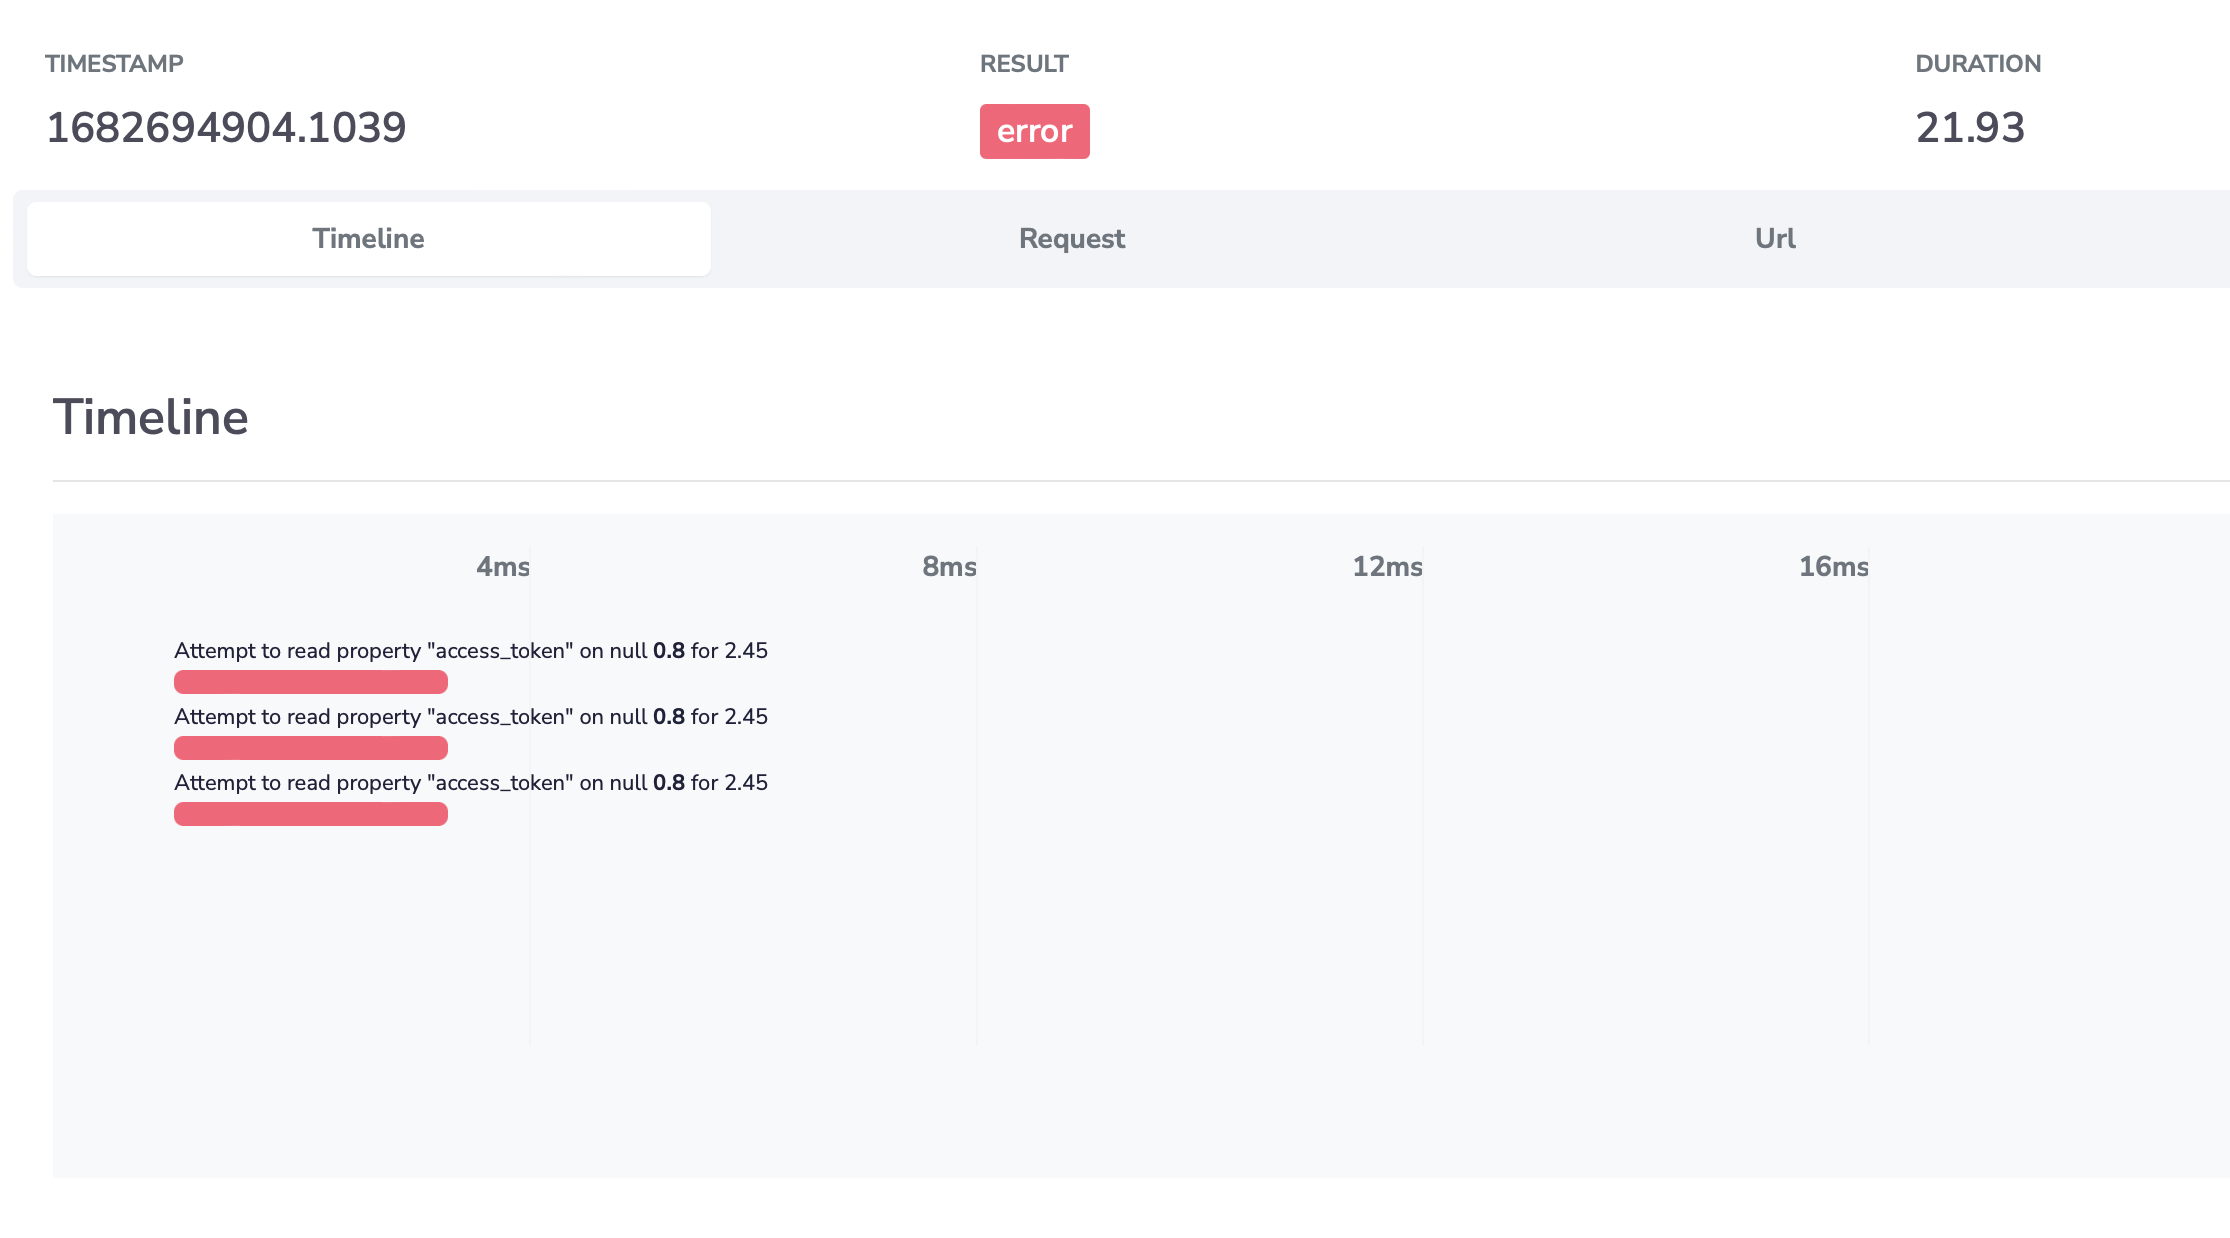
Not the right person to deal with the incident, you can easily transfer it to someone who is more suitable.
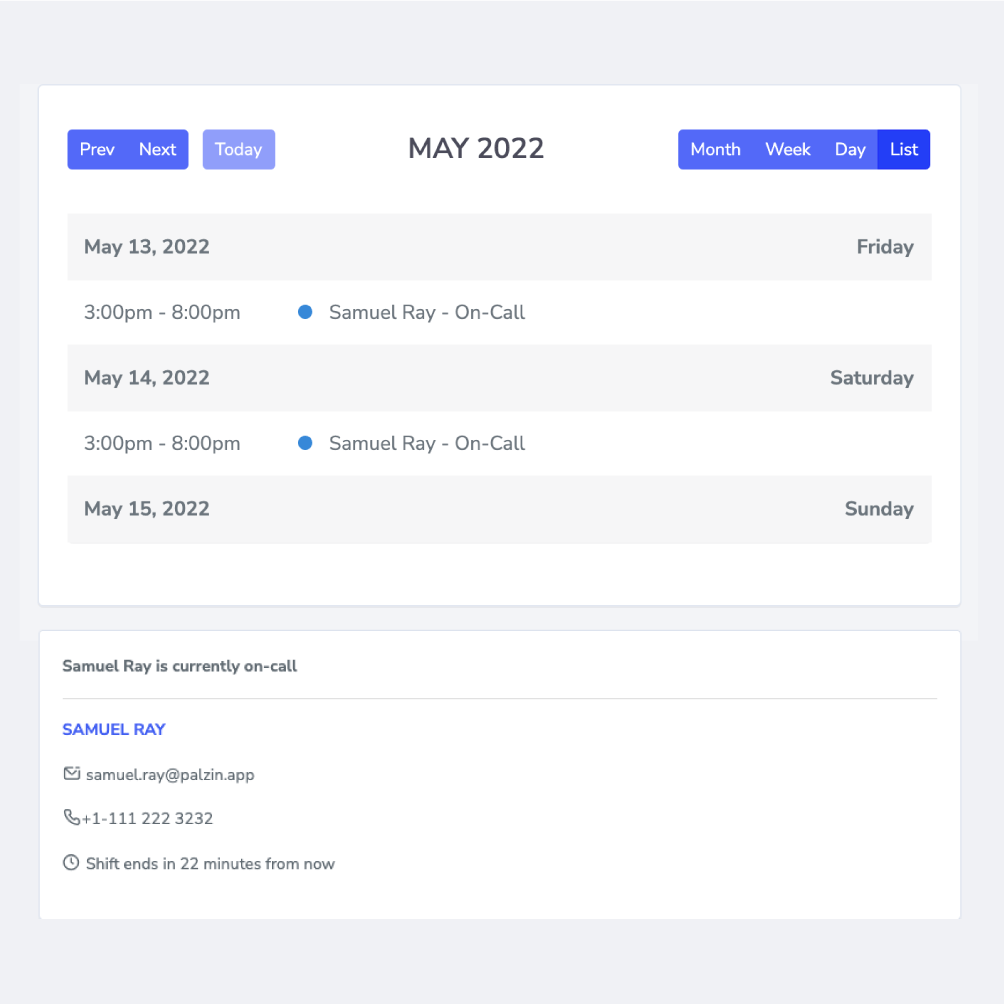
Customize on-call duty rotations to ensure that the right people are alerted at the right time, and avoid unnecessary alerts.

Palzin Monitor validates incidents with multiple locations to avoid wasting your time with false alarms.

Collaborate with colleagues to fix root causes of incidents, and easily debug information with our incident management feature.

Ensure faster resolution of critical incidents with Palzin Monitor's War Room feature, enabling seamless communication and collaboration for responders.
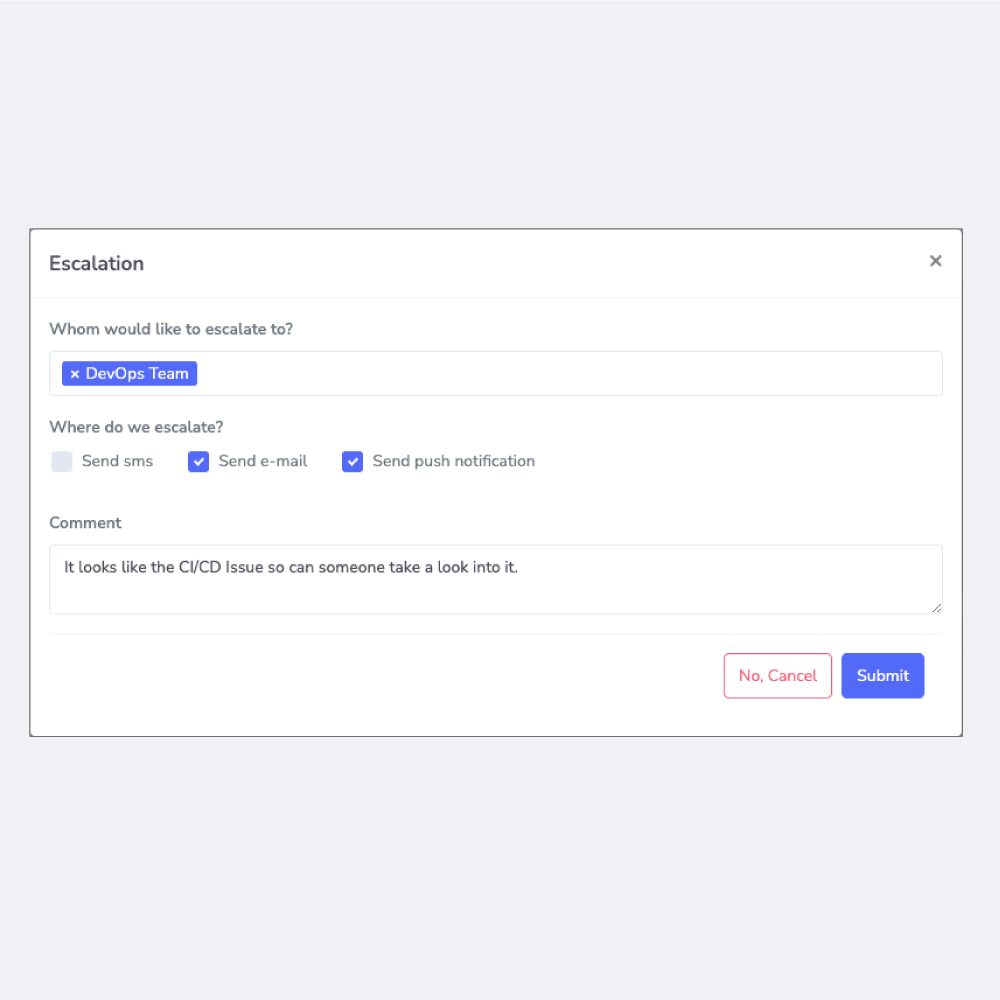
Customize your escalation path based on the incident origin and context, so that the right people are notified at the right time.
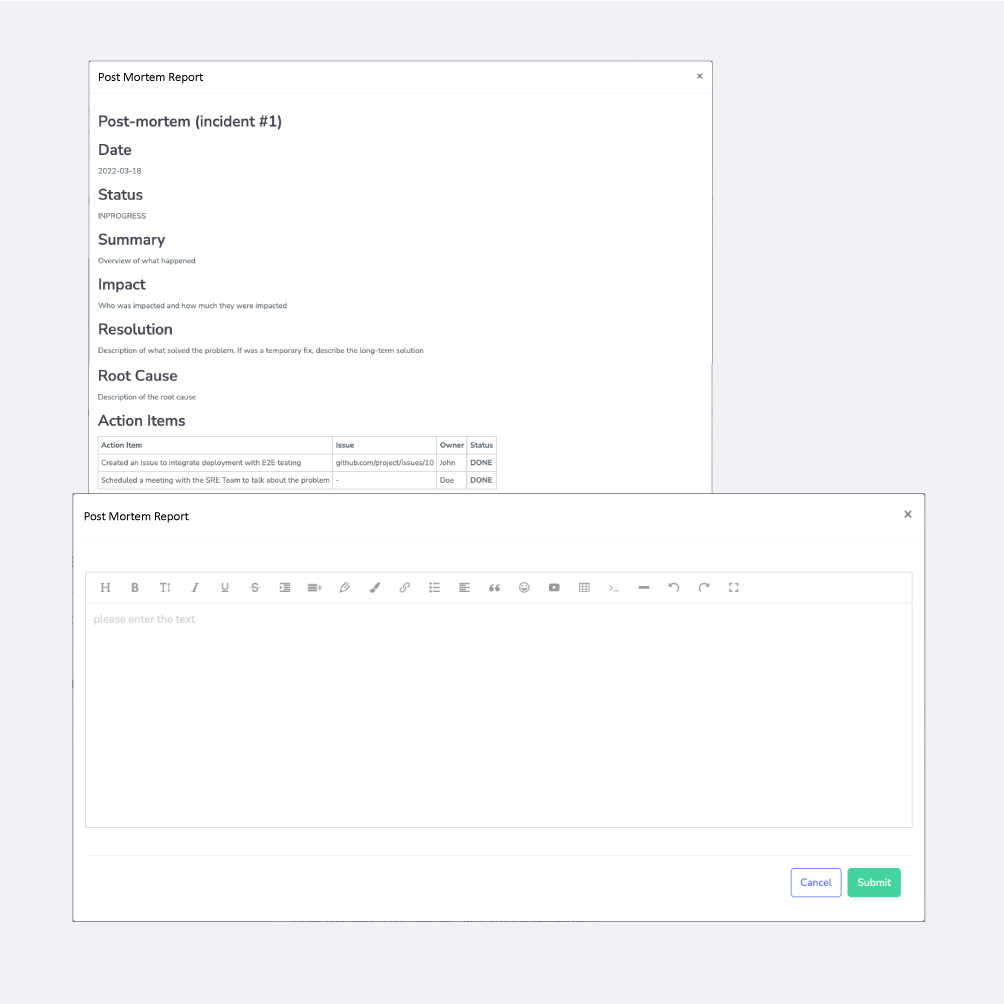
Prepare for future incidents by conducting root cause analysis with our postmortem feature. Describe the cause, estimated cost, and prevention measures for each incident.
Monitor the performance of your application in real-time with Palzin Monitor captures all requests without any code modifications, enabling you to analyze the impact of your methods, database statements, and external requests on your users' experience.
Easily identify application processes that consume resources, such as HTTP requests, background tasks, and jobs.
Observe a detailed graphical display of the execution sequence to promptly pinpoint areas that require optimization. By analyzing the timeline, you can readily determine the statements that hold the greatest relevance in each procedure.
Distinguish between good and bad process performance with ease. Our tool provides a fast way to identify and resolve performance issues in specific parts of your code, saving you time and effort.
Palzin Monitor collects exceptions and crashes with full stack frames, enabling fast error resolution across applications.
Quickly identify high-priority production exceptions and link them to our Service module to receive immediate notifications.
Palzin Monitor captures pertinent data such as URL, port, user, app, version, user agent, etc. to provide a context for error occurrences and expedite the debugging process.

Say goodbye to the hassle of checking multiple tools.
Palzin Monitor, the all-inclusive website monitoring solution, provides an extensive range of features.
Palzin Monitor serves as a complete replacement for all your current subscriptions.:
Similar features in other tools may cost

50 Monitors
10K Transactions
10 Custom Status Pages
4 Continents
25 SMS / Voice Calls Alerts
Discover how 100's of companies use Palzin Monitor to build products users love to drive customer satisfaction and growth.
It takes less than a minutes to setup your first monitoring.