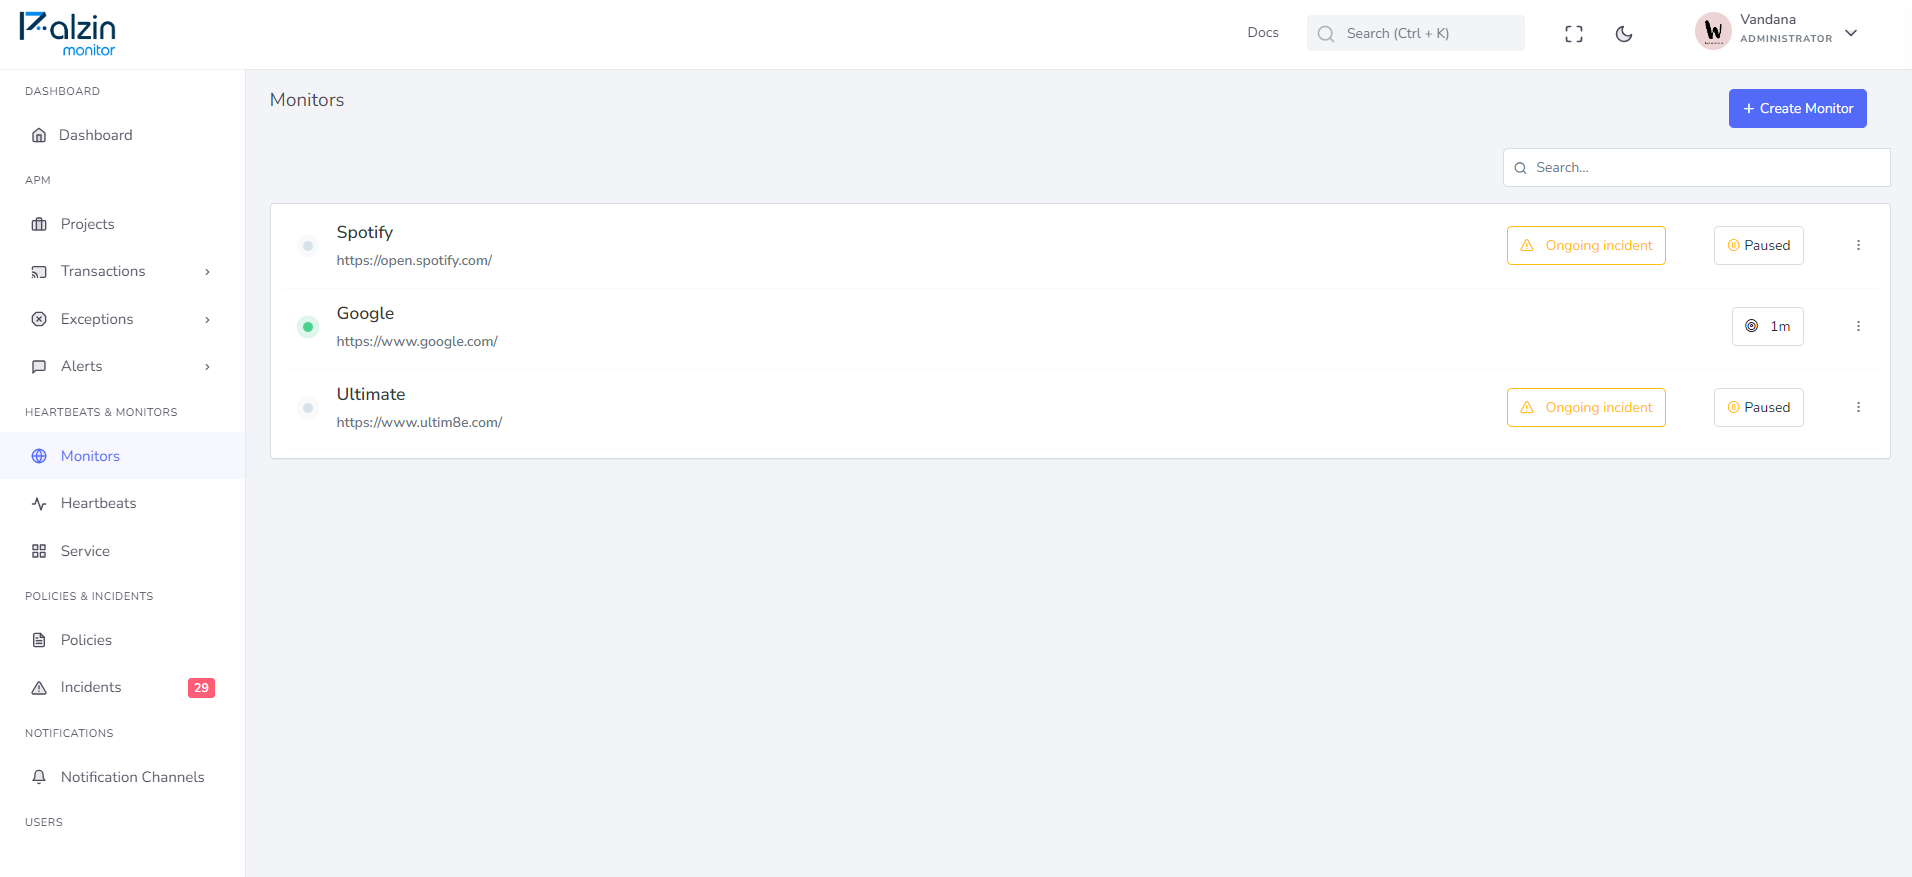
Synthetic monitoring is a proactive approach to monitoring websites and applications. It involves simulating user actions to test the availability, performance, and functionality of a service.
Unlike Real User Monitoring (RUM), which relies on actual users to initiate tests, synthetic monitoring is an active monitoring solution that runs automated tests at predefined intervals.
 Palzin Monitor provides a synthetic monitoring service and can help you receive alerts when your service stops working.
Synthetic monitoring tools use robot clients to send automated requests to applications, mimicking user interactions. For example, uptime monitoring is a common method used in synthetic monitoring:
To ensure that a homepage is accessible to visitors at all times, an automated script called an uptime monitor is used. This monitor periodically sends a GET request to the homepage (e.g., every minute) and checks if the URL responds with a 200 OK status code indicating a functioning site. If the URL fails to respond correctly, an incident is triggered, and the on-call team is alerted.
To learn more about the details of uptime monitoring, you can refer to this guide on Palzin Monitor.
Synthetic monitoring encompasses various types of monitoring to assess availability, performance, and functionality. Some common types include:
Availability monitoring focuses on checking the accessibility of a service. The main forms of availability monitoring are:
Performance monitoring assesses the speed and responsiveness of a service. Key types of performance monitoring include:
Functionality monitoring verifies the proper functioning of critical features or transactions. Examples include:
These different types of synthetic monitoring allow organizations to proactively identify and address issues before they impact real users.
Synthetic monitoring offers several benefits:
Synthetic monitoring runs automated scripts at regular intervals, such as every minute or every hour, providing valuable information without requiring constant manual intervention.
Different types of monitors in synthetic monitoring allow for testing various aspects of a system, from homepage latency to specific user signup flow steps. This flexibility enables developers to monitor and analyze different components of their applications.
With synthetic monitoring, it's possible to check the availability, performance, and functionality of a system from various locations worldwide. This helps identify and distinguish regional errors from incidents affecting all users, enabling optimization for a global audience.
By simulating real user behavior, synthetic monitoring makes it easier to assess whether a service is functioning correctly. Browser and device-specific monitoring allows for the quick detection and investigation of performance changes and issues.
Synthetic monitoring can be implemented both inside and outside the firewall, providing the ability to monitor machines within data centers or local networks, not just from a global perspective.
Here are some reasons to consider using synthetic monitoring:
Synthetic monitoring automatically detects performance degradation or availability issues in websites, apps, or APIs. When an issue is identified, it triggers an incident management process, alerting the appropriate team member according to the on-call schedule. This allows problems to be addressed promptly, often before they impact a significant number of users.
Synthetic monitoring, especially transaction monitoring, ensures that essential business transactions, such as new signups, cart checkouts, or subscription payments, are monitored and functioning correctly. This helps safeguard revenue-generating activities and maintains a positive user experience.
By consistently running synthetic monitoring over a long period, it provides valuable insights into the performance of an application. Historical data on latency, page speed, and other metrics can be analyzed to identify long-term trends and potential areas for improvement. It also enables benchmarking against competitors or previous versions of the application.
Real browser monitoring and data recording through synthetic monitoring provide valuable insights into the user experience. Performance issues can be pinpointed to specific components, allowing for optimization and improved user satisfaction.
Modern applications often rely on various integrations such as payment processing, site search, recommendation plugins, CDNs, CRMs, or analytics tools. Monitoring the functionality of these integrations is crucial to identify any performance degradation or downtime incidents. It also helps in incident communication with users and holding third-party vendors accountable.
Synthetic monitoring can help businesses adhere to service level agreements (SLAs) and demonstrate compliance to clients. By using synthetic monitoring data, vendors can showcase their adherence to SLAs, while clients can ensure they receive the agreed-upon service levels or seek appropriate compensation for any SLA violations.
Before launching in new locations or deploying new websites or process flows, synthetic monitoring allows for assessing performance and functionality. It ensures everything is working correctly before directing real users to the new resources.
Real User Monitoring (RUM) is an active monitoring method that captures data based on real user activity. It provides insights into how users interact with a website in real-time. RUM tracks metrics such as visits, load times, performance across different locations, devices, and browsers.
Compared to synthetic monitoring, which runs scheduled pre-defined tests, RUM tracks real user behavior, revealing trends and issues that may not have been previously
considered. However, RUM requires website traffic to generate valuable insights, making it more useful after synthetic monitoring is established and sufficient traffic is achieved.
Both synthetic monitoring and RUM offer unique insights, and using them together provides comprehensive monitoring coverage.
To get started with synthetic monitoring, you can use a tool like Palzin Monitor, which offers a wide range of monitoring options. Here's a step-by-step guide on how to get notified when a URL becomes unavailable (returns a code other than 200 OK):
For more information and detailed documentation on Palzin Monitor, you can explore their official documentation.
It takes less than a minutes to setup your first monitoring.