Uptime monitoring is an automated process that checks the availability of a website or application. It ensures that the service is up and running and alerts the appropriate person on the development team if any issues occur.
If you want to receive alerts when your website experiences downtime, you can visit Palzin Monitor and start monitoring within just two minutes.
Uptime monitoring involves sending automated HTTP requests to a specific URL at regular intervals. These requests, usually in the form of HTTP GET requests, verify that the desired response is received. The frequency of these checks can vary based on the user's needs, ranging from 30 seconds for business websites to longer intervals for personal projects.
The expected response from the monitored URL is typically the "200 OK" HTTP response code, indicating that the service is available. However, users can configure the monitoring system to check for specific keywords in the response to ensure that critical parts of the website, such as signup or subscription functionality, are working correctly.
When the monitored URL responds with the expected code or keyword, the monitoring process continues without any further action. However, if a different response code or no response is received within the specified time frame, the monitoring system registers a downtime incident and initiates alerts based on the predefined on-call calendar.
Keyword monitoring examines the HTML of the monitored URL to check for the presence or absence of specific keywords. By analyzing the HTML code, it can verify the existence of desired elements like a particular <div> or a signup button.
Using keyword monitoring alongside simple response code monitoring is recommended for uptime checks. Keyword monitoring provides an additional layer of protection by allowing users to check key components of a URL. This can include crucial elements like a call-to-action button or the title of a blog post, ensuring that important user actions are functioning correctly.
A downtime incident refers to a period during which a service is unavailable. Users who attempt to access the service during this time will encounter an error page. Additionally, a downtime incident can occur when the monitoring system does not receive a response within a specific time frame. Setting the monitor sensitivity correctly is crucial to avoid excessive false-positive alerts.
Once an incident is detected by the uptime monitoring tool, it needs to be communicated to the appropriate individuals. This process, known as incident alerting or on-call alerting, involves notifying the team member responsible for handling incoming incidents according to the on-call calendar.
Common methods of receiving alerts from an uptime monitor include automated phone calls, SMS messages, and notifications through platforms like Slack or Microsoft Teams. The choice of alerting method depends on factors such as the importance of the monitored service, time of day, and team preferences. Less critical monitors may use push notifications or emails.
Downtime incident alerts provide information about the specific monitor that detected the downtime and the time at which it occurred. They also include details about the error that triggered the incident, such as the received response. In addition, a screenshot of the website or application at the time of the incident is often included, providing insights into what went wrong and the user experience during the downtime.
Downtime alerts typically allow the recipient to acknowledge the incident, signifying their awareness of the issue. This acknowledgement can help streamline the incident management process and prevent unnecessary escalations.
After receiving an alert, the first step is to acknowledge it promptly. If the alert goes unacknowledged within a specific time frame (typically 3 to 5 minutes), the next person in the on-call duty rotation is notified. This process continues until the entire team is alerted. To ensure a smooth incident resolution process, it is advisable to set up the on-call schedule in a way that the first team member is always prepared to handle incoming incidents.
Acknowledging the incident pauses the escalation process, allowing the team to focus on resolving the issue. The time taken to acknowledge an alert is known as Time to Acknowledge (TTA), and the average TTA across different incidents is referred to as Mean Time to Acknowledge (MTTA), which serves as a common incident management metric.
The subsequent steps in the downtime resolution process vary depending on different teams and applications. For larger teams, these steps may involve collaboration among multiple developers or teams, delegation of incidents to dedicated team members, and other strategies. However, there are some best practices that all teams should follow when managing incidents, such as effective incident communication (both internal and external) and conducting post-mortems to learn from incidents and improve future incident response.
Fix issues before affecting users: Uptime monitoring runs automated checks as frequently as every 30 seconds, allowing for immediate detection of any issues. In an ideal scenario, downtime can be resolved quickly, minimizing the number of affected users.
Benchmark and plan improvements: Continuous monitoring over an extended period provides valuable insights into app performance, including uptime and latency. This historical data enables benchmarking against competitors or older versions of the same app or product.
Measure SLAs guarantee: Service Level Agreements (SLAs) are crucial for many software businesses. Uptime monitoring allows vendors to demonstrate adherence to SLAs, giving them a competitive edge in the sales process. Clients can also utilize uptime monitoring to ensure SLAs are met and receive compensation for any violations.
Hold third parties accountable: Modern applications often rely on integrations like payment processing, site search, recommendation plugins, CDNs, CRMs, or analytics. Monitoring the functionality of these integrations is necessary to address performance degradations or downtime incidents. It also facilitates effective incident communication with users and holds vendors accountable, even if the vendors have public status pages.
Benefits:
Automated with regular frequency: Uptime monitoring can run at any desired interval, from every minute to once a day, throughout the year. It requires minimal maintenance once set up and provides valuable information consistently.
Simple to set up and use: Monitoring for any URL can be set up within minutes, offering availability information from the start. It is applicable to a wide range of websites and apps with different types and use cases, providing simple up/down information.
Global testing: Uptime monitoring allows testing from multiple endpoints worldwide, enabling differentiation between regional errors and incidents affecting all users. It also facilitates optimization for a global audience.
Drawbacks:
Limited downtime cause reporting: Uptime monitoring focuses on the final output and does not provide detailed information on the root cause of downtime. To gain insights into the underlying reasons, additional tools like Application Performance Management (APM) or log management services need to be utilized.
Limited functionality monitoring: Uptime monitoring primarily focuses on the status of a specific URL and may not detect smaller issues that don't result in downtime but still impact the user experience significantly. To monitor such issues, transaction monitoring or keyword monitoring can be employed.
While uptime monitoring is a key component of synthetic monitoring, it is not the only aspect.
In website monitoring, uptime checks are ideally complemented by SSL certificate checks and domain expiration checks to prevent security issues and the loss of critical business assets. Synthetic monitoring also offers other monitoring options such as API checks, DNS monitoring, and transaction monitoring.
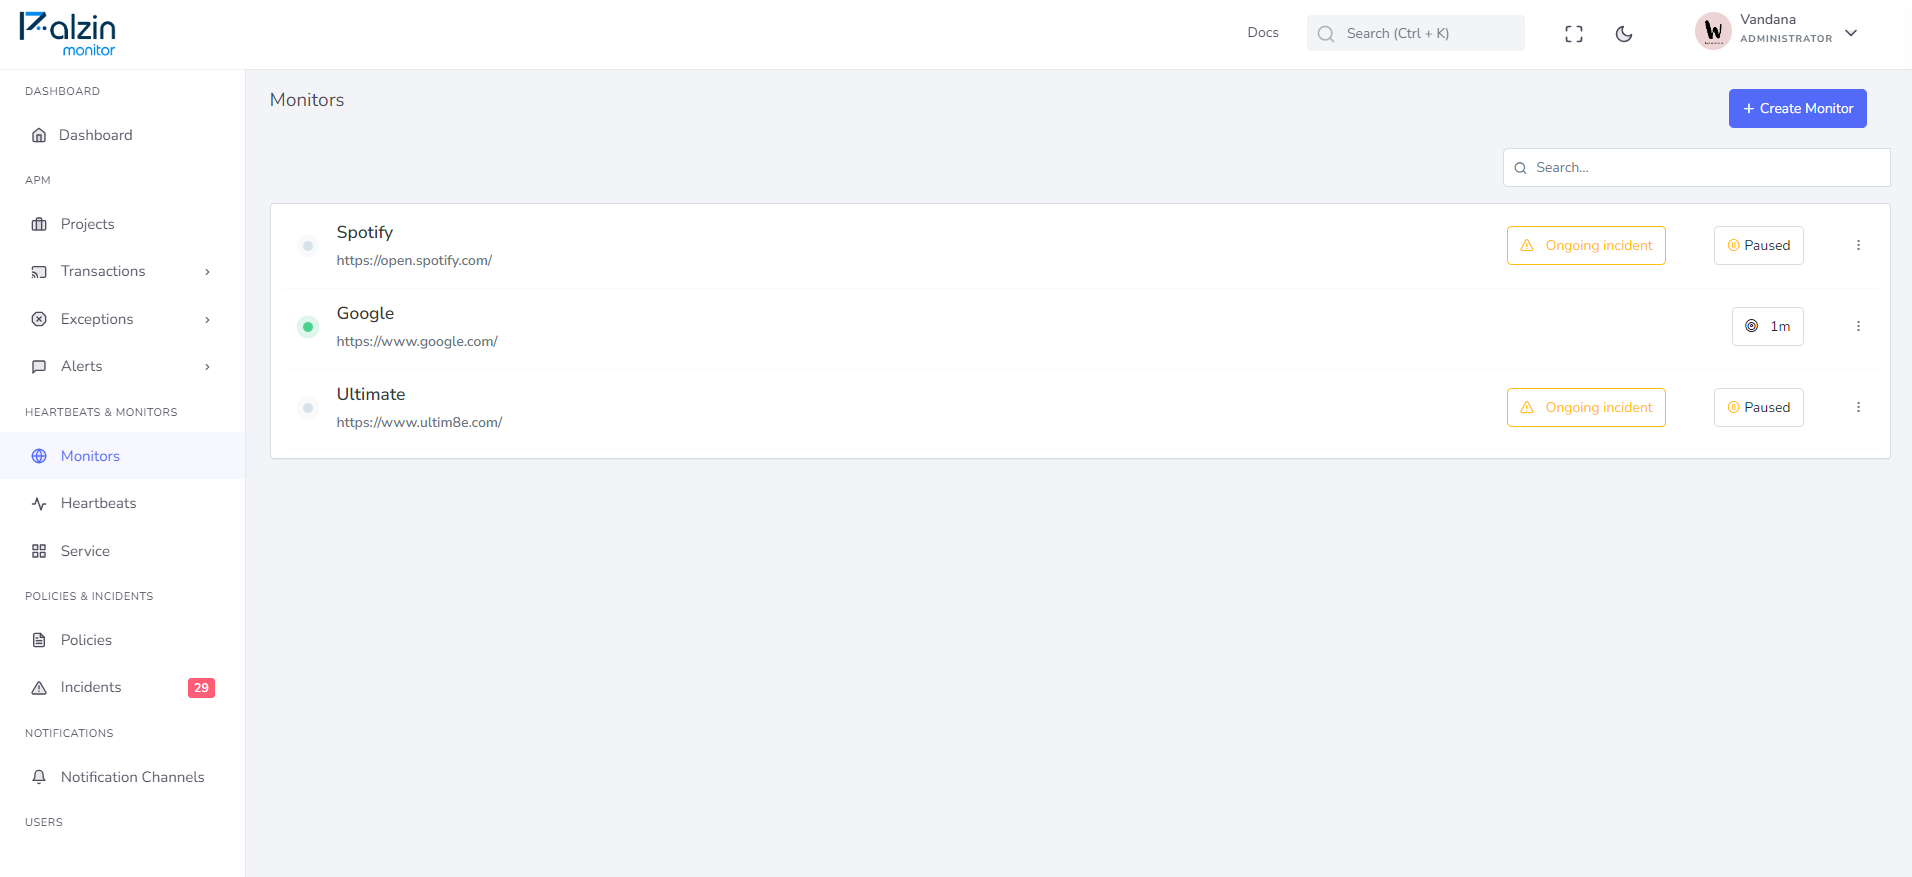
Palzin Monitor is an infrastructure monitoring tool that offers free uptime monitoring. Here's a quick guide to getting notified when a URL becomes unavailable (returns a code other than 200 OK):
It takes less than a minutes to setup your first monitoring.


