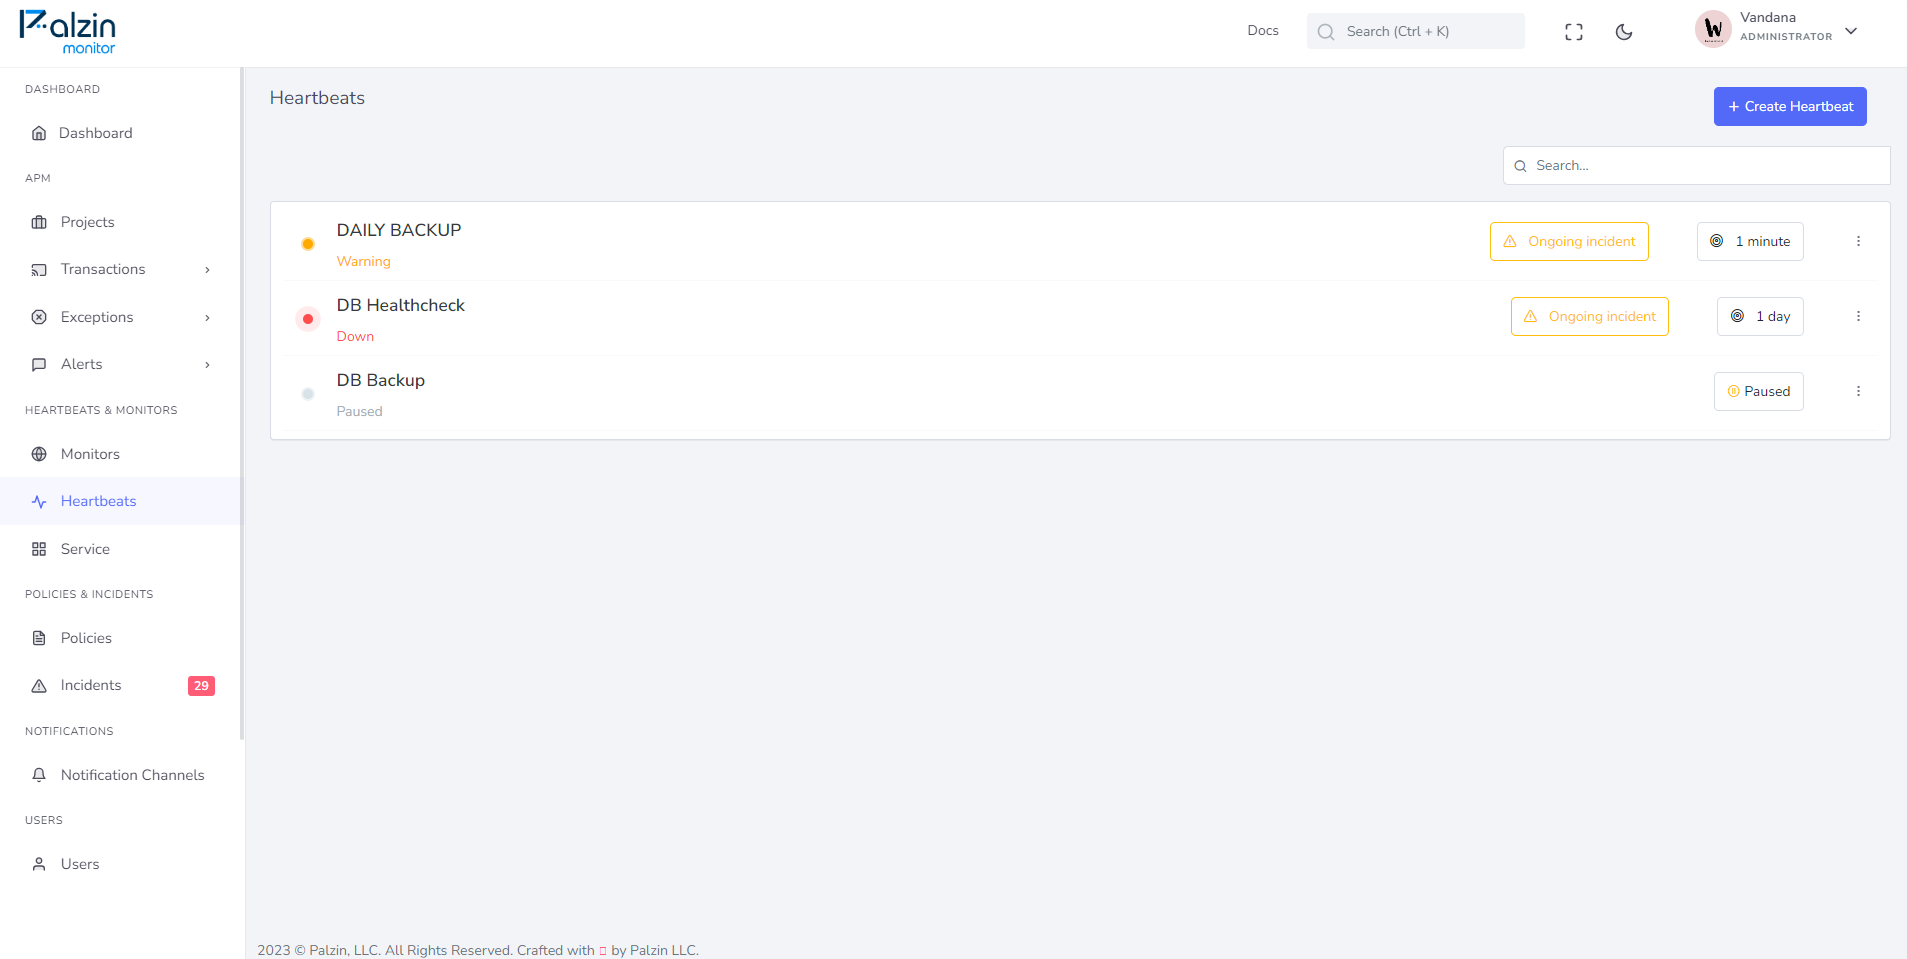
Cron job or heartbeat monitoring is an automated way of checking whether scheduled tasks run correctly. It is an ideal monitoring solution for services that perform vital processes periodically.

Go to Palzin Monitor and start monitoring your cron jobs in just 2 minutes.
The cron job monitoring process involves setting up a remote monitoring service with a dedicated URL. After a scheduled task runs correctly, it sends a GET, HEAD, or POST request to this URL. This process, known as heartbeat monitoring, tracks the system's health by sending regular requests.
The heartbeat monitor expects to receive a heartbeat within a specified time window. If a heartbeat is received, the monitoring continues. However, if no heartbeat is received when expected, the monitor initiates an incident and starts alerting the appropriate person on the development team based on the on-call calendar.
A cron job incident occurs when the monitor does not receive heartbeats from the monitored service within the expected time frame. This indicates that the monitored service did not run correctly since all successful runs should send a heartbeat to the monitor.
After an incident is detected by the cron job monitor, it needs to be communicated to the service administrators. This process, known as incident alerting or on-call alerting, involves notifying the person who is currently on-call for the team. Various methods can be used for alerting, including automated phone calls, SMS, Slack, and Microsoft Teams messages.
Incident alerts for cron jobs and heartbeats provide basic up/down information about the monitoring status. To gain more in-depth insights into potential incidents with scheduled jobs, it is recommended to implement logging in the monitored services and use a log aggregation tool.
Once an alert is received, it should be acknowledged immediately. If the alert is not acknowledged within a specified time frame (usually 3 minutes), the next person on the on-call duty is alerted. The goal is to have the on-call schedule set up in a way that the first team member is always ready to handle incoming incidents.
After acknowledging an incident, the escalation process is paused, and the team can focus on resolving the issue. The speed at which an alert is acknowledged is measured as the Time to Acknowledge (TTA), and the average time across different incidents is known as the Mean Time to Acknowledge (MTTA).
The specific steps for resolving a downtime incident may vary depending on the team and the application. Larger teams may involve collaboration between multiple developers or dedicated incident response teams. Best practices for incident management include effective incident communication (both internal and external) and conducting incident post-mortems.
Cron job monitoring is a valuable addition to the synthetic monitoring toolbox. It complements regular uptime checks, SSL certificate checks, and domain expiration checks to prevent security issues and protect valuable business assets. Synthetic monitoring also offers options like API monitoring, DNS monitoring, and transaction monitoring.
Palzin Monitor is an infrastructure monitoring tool that includes cron job monitoring. Follow these steps to receive alerts whenever a service fails to run correctly, using the example of monitoring a database backup:
For more detailed instructions, refer to the Palzin Monitor documentation.
Assuming you have a script for the database backup, you can create a cron job to execute it and send the heartbeat:
Open the crontab file using the command crontab -e.
Append the following line at the end of the file, replacing <your-heartbeat-monitor-id> with the actual URL of your heartbeat monitor:
0 0 * * * bash /database/backup/script && curl https://palzin.app/api/v1/heartbeat/<your-heartbeat-monitor-id>
The above cron job runs the backup script at midnight every day and sends a heartbeat to the monitor using curl.
Ensure that the heartbeat interval in the cron job matches the expected interval set for the heartbeat monitor.
For more detailed instructions, refer to the Palzin Monitor documentation.
We notify you when your website experiences downtime
Stay informed with a comprehensive infrastructure monitoring platform
Check Uptime, Ping, Ports, SSL, and more.
Receive incident alerts via Slack, SMS, and phone.
Easily schedule on-call duties.
Create a free status page on your own domain.
It takes less than a minutes to setup your first monitoring.