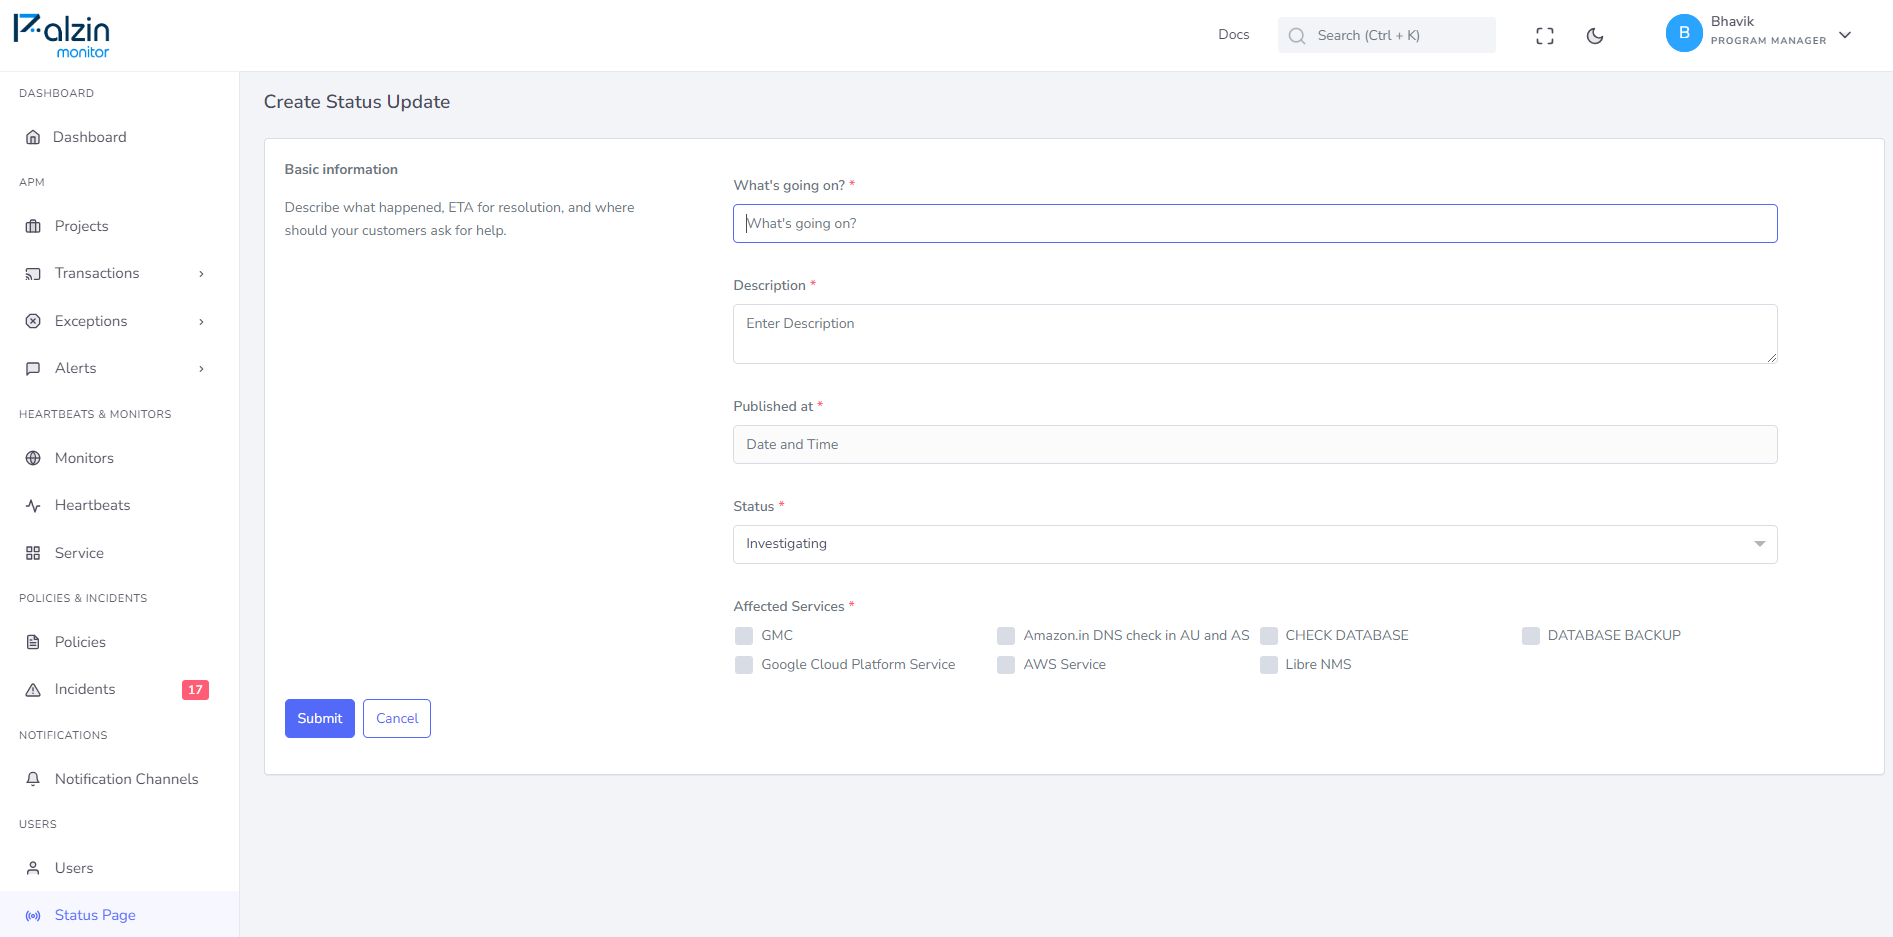
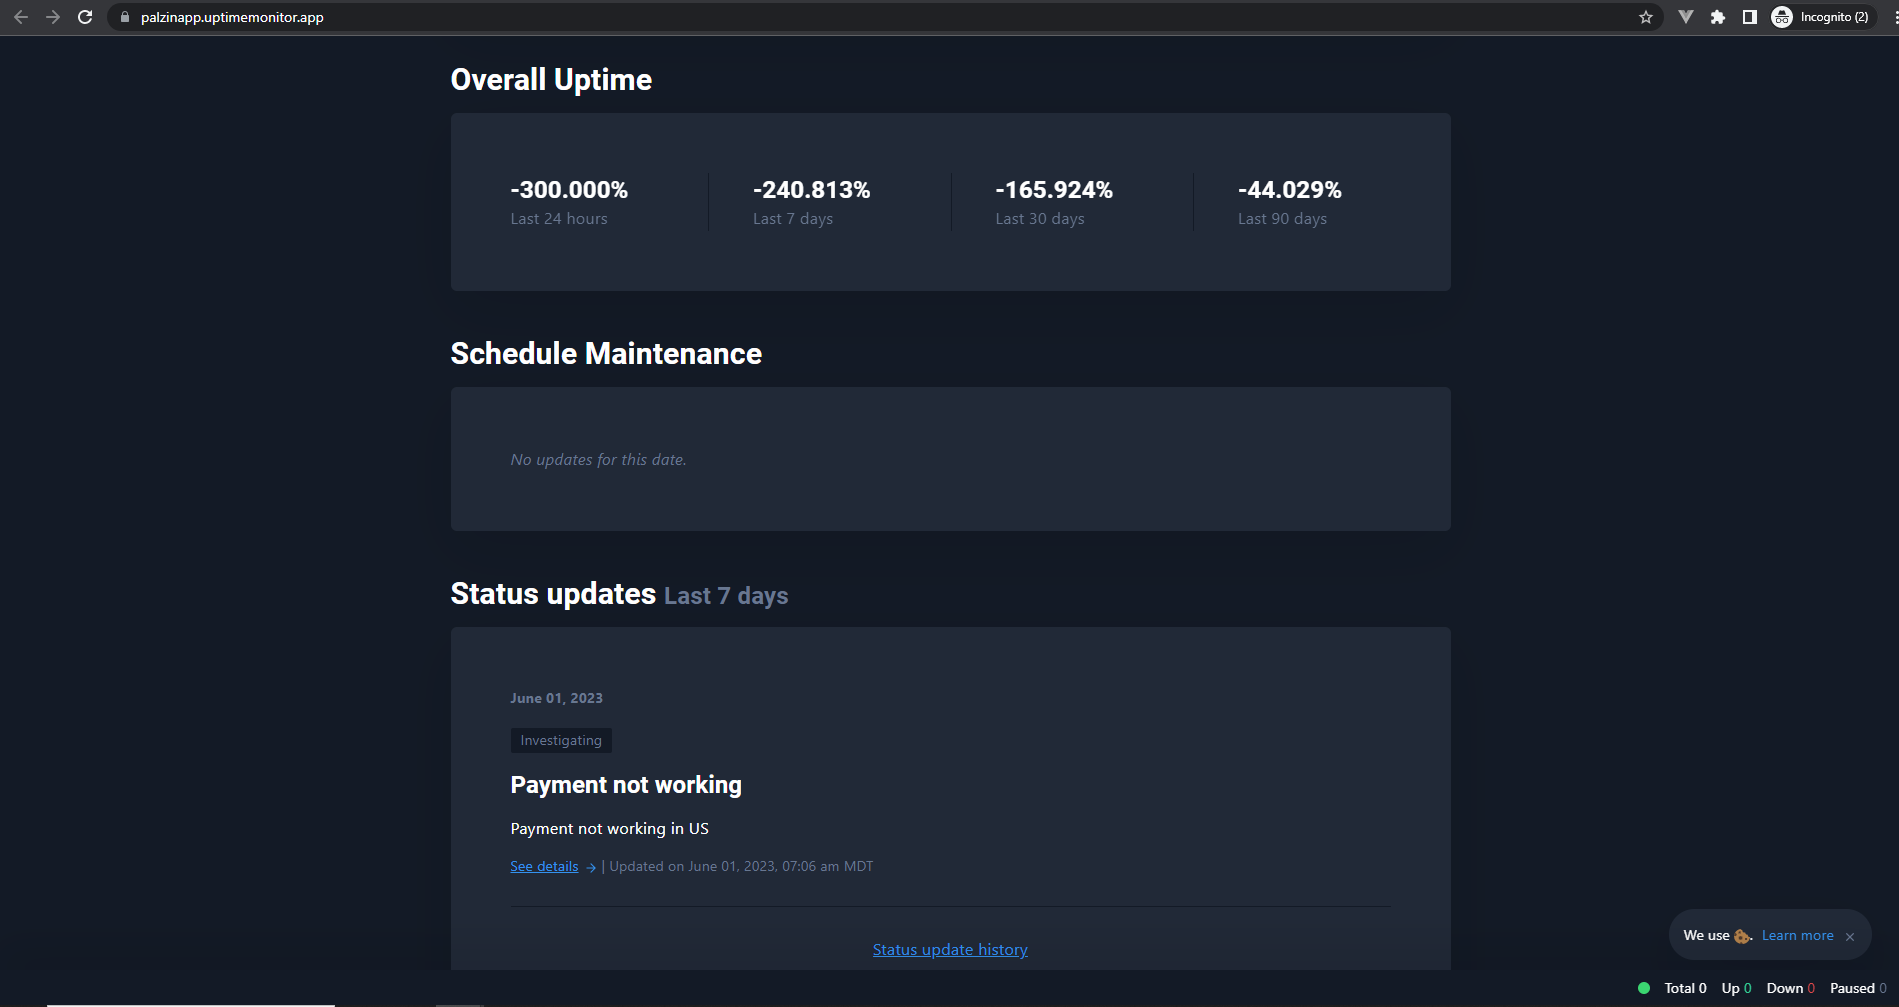
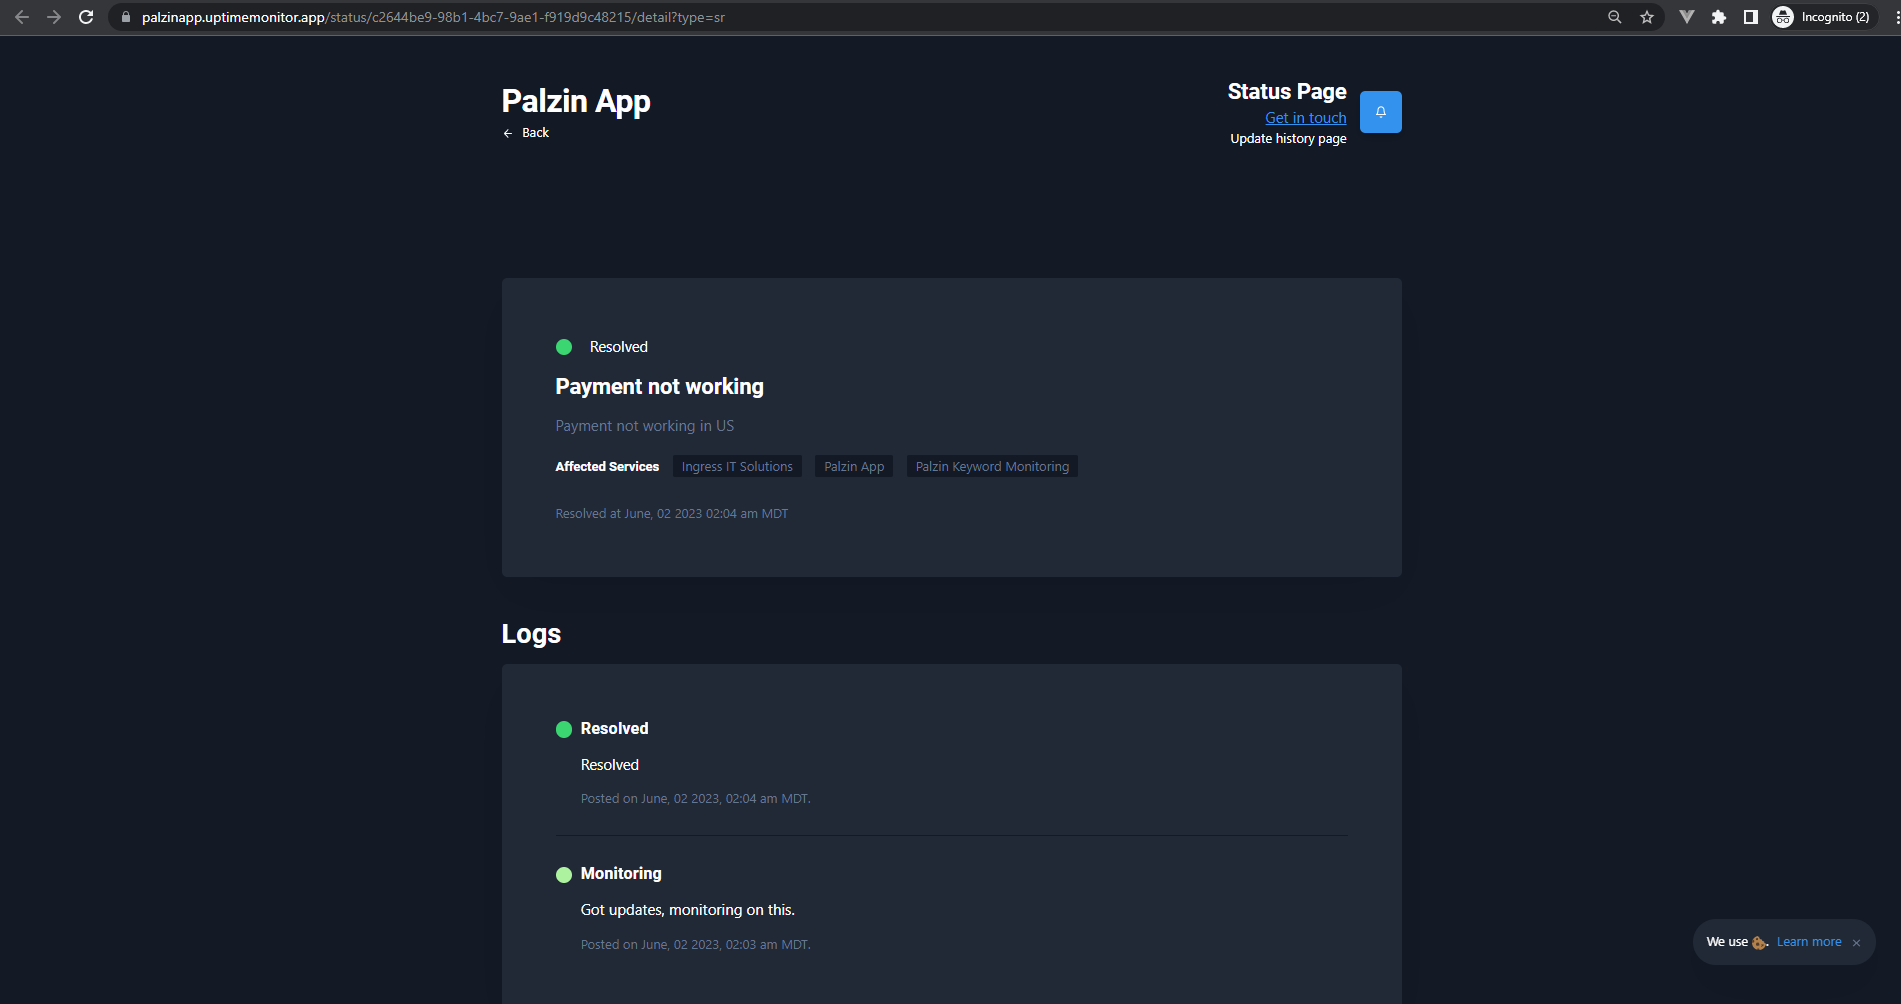
Status page reports provide an opportunity to convey additional information about an incident in a more detailed manner.
These reports often include crucial details like estimated time for resolution, as well as a comprehensive overview of the affected services, distinguishing between those that are completely unavailable and those experiencing performance degradation.
Typically, status page reports are composed of multiple status updates, enabling you to keep your audience informed throughout the incident.
The status update serves as a timely and informative update on a specific incident report.
Following best practices, when an incident occurs, it is recommended to create a status page report indicating the service's current state, whether it is experiencing degradation or downtime. Once the incident has been successfully resolved, an additional status update should be appended to the existing report, clearly indicating that the incident has been resolved.


Example
Imagine that one of the websites we monitor experiences a complete outage. In such cases, the monitor on the status page will turn red, indicating downtime.
To provide our users with more detailed information, we will generate a new report titled "Homepage is Unavailable" and update the status of the homepage monitor from "Not Affected" to "Downtime". Additionally, we can include a brief description of the incident, such as: "The example.com website is currently inaccessible for all users."
Next, we will initiate an investigation into the issue, and as soon as we have any updates (for instance, if we discover that our cloud provider is encountering difficulties), we will create a status update to share that information.
Once our cloud provider resolves the issue and the homepage is accessible again, we will publish a new status update and change the affected services dropdown menu to "Resolved".
It takes less than a minutes to setup your first monitoring.