Service and integration
Make sure to add the Splunk integration and copy the webhook.
Create integration and service on our dashboard
Go to the settings from dashboard.
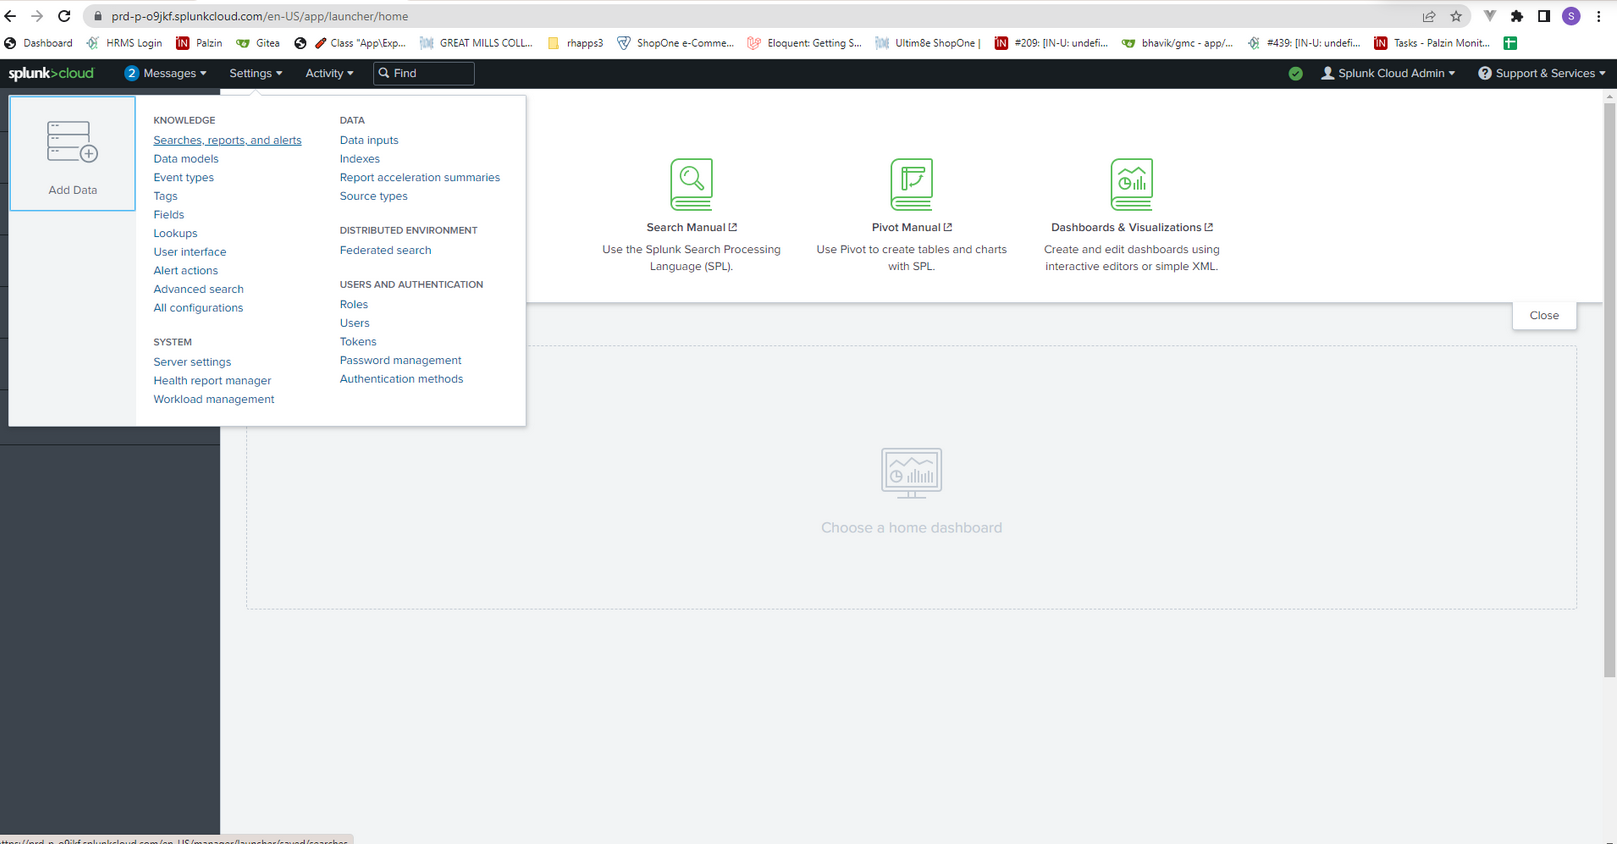
Click on searches, reports and alerts.
Click on Add Actions.
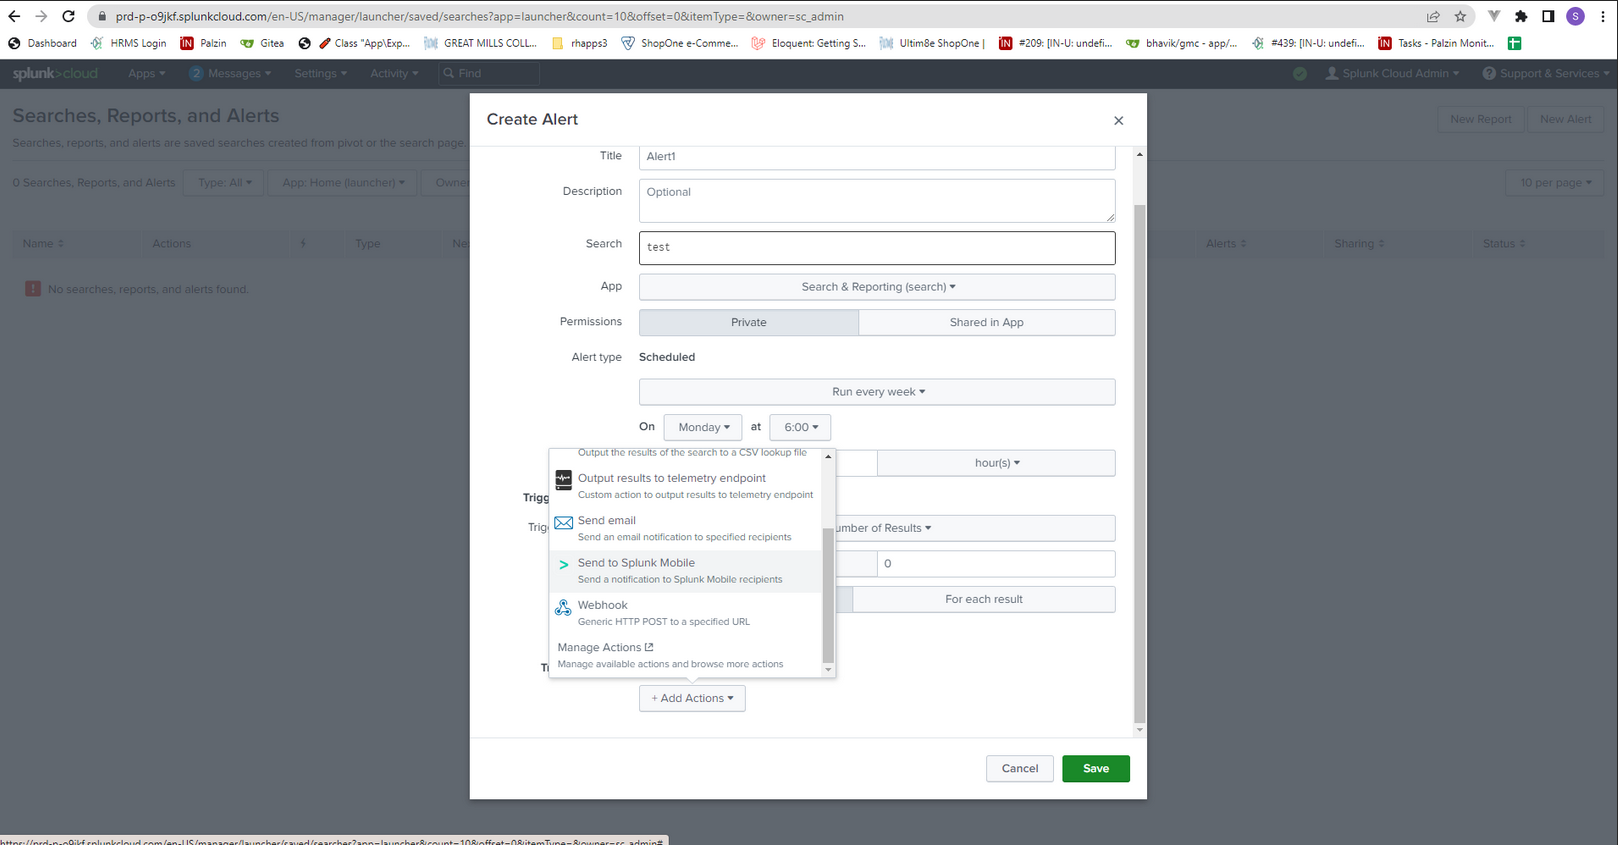
Select Webhook.
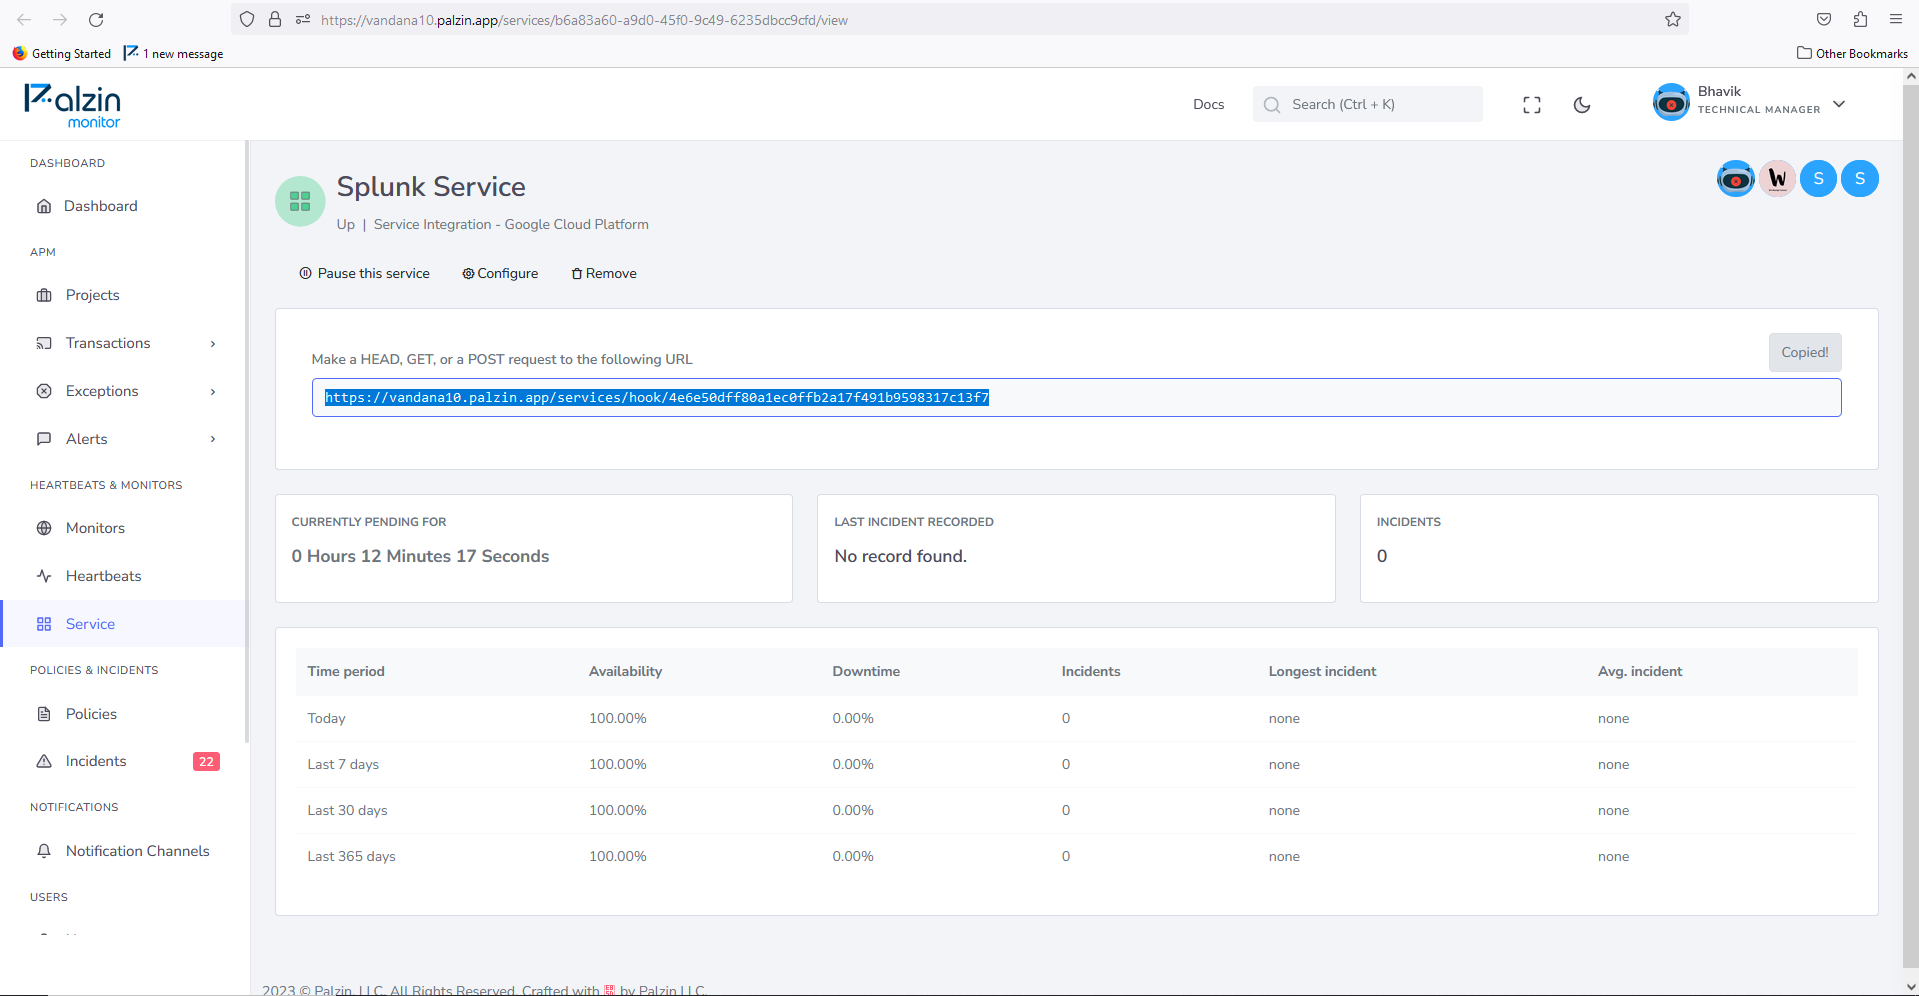
Copy URL from your palzin instance service view page.
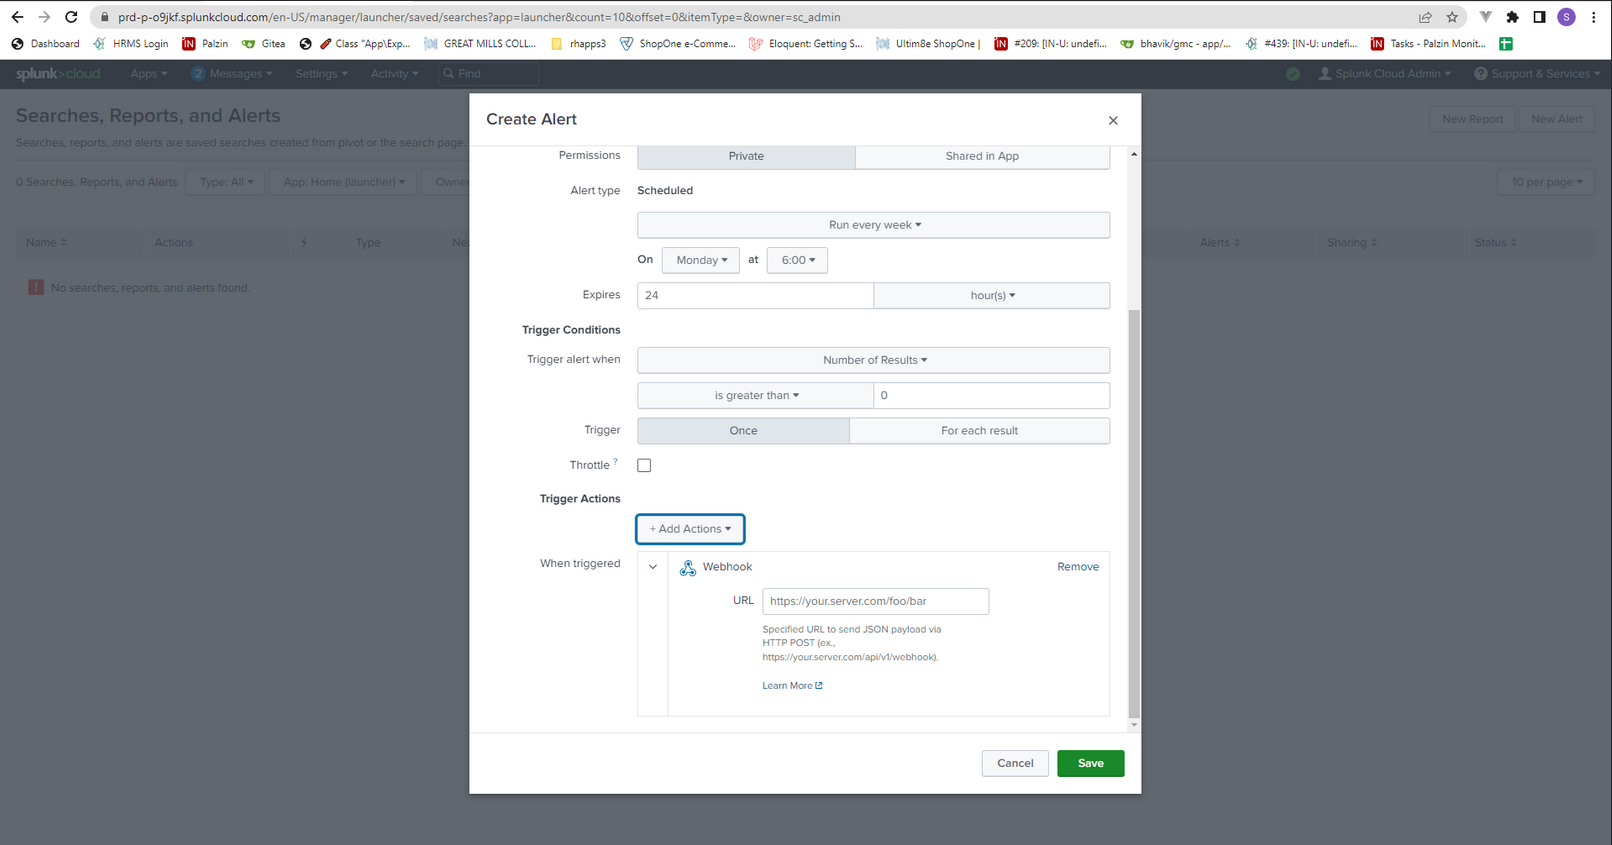
Paste the Palzin Monitor webhook URL and save.
In your palzin instance, an incident will be created. That will contain these details.
{
    "detector": "Memory usage detector",
    "detectorUrl": "https://app.test.signalfx.com/#/detector/ABCDEFGHIJK/edit",
    "description": "Memory has reached 90% of maximum for 10 minutes",
    "incidentId": "BCDEFGHIJKL",
    "eventType": "foo",
    "rule": "Running out of memory",
    "severity": "Minor",
    "detectOnCondition": "when(A > 90, '10m')",
    "detectOffCondition": "when(A < 90, '15m')",
    "status": "ok",
    "statusExtended": "ok",
    "imageUrl": "https://org.test.signalfx.com/#/chart/abCDefGHij",
    "timestamp": "2016-11-08T19:43:30Z",
    "inputs": {
    "_S1": {
        "dimensions": {
        "host": "i-asfasd",
        "plugin": "signalfx-metadata"
        },
        "value": 96.235234634345,
        "fragment": "data('memory.utilization')"
    }
    },
    "sf_schema": 2
}
It takes less than a minutes to setup your first monitoring.


