Make sure you have the service and integration already setup for Dynatrace. Follow the link below on instructions of how to create integration and service
Create integration and service on our dashboard
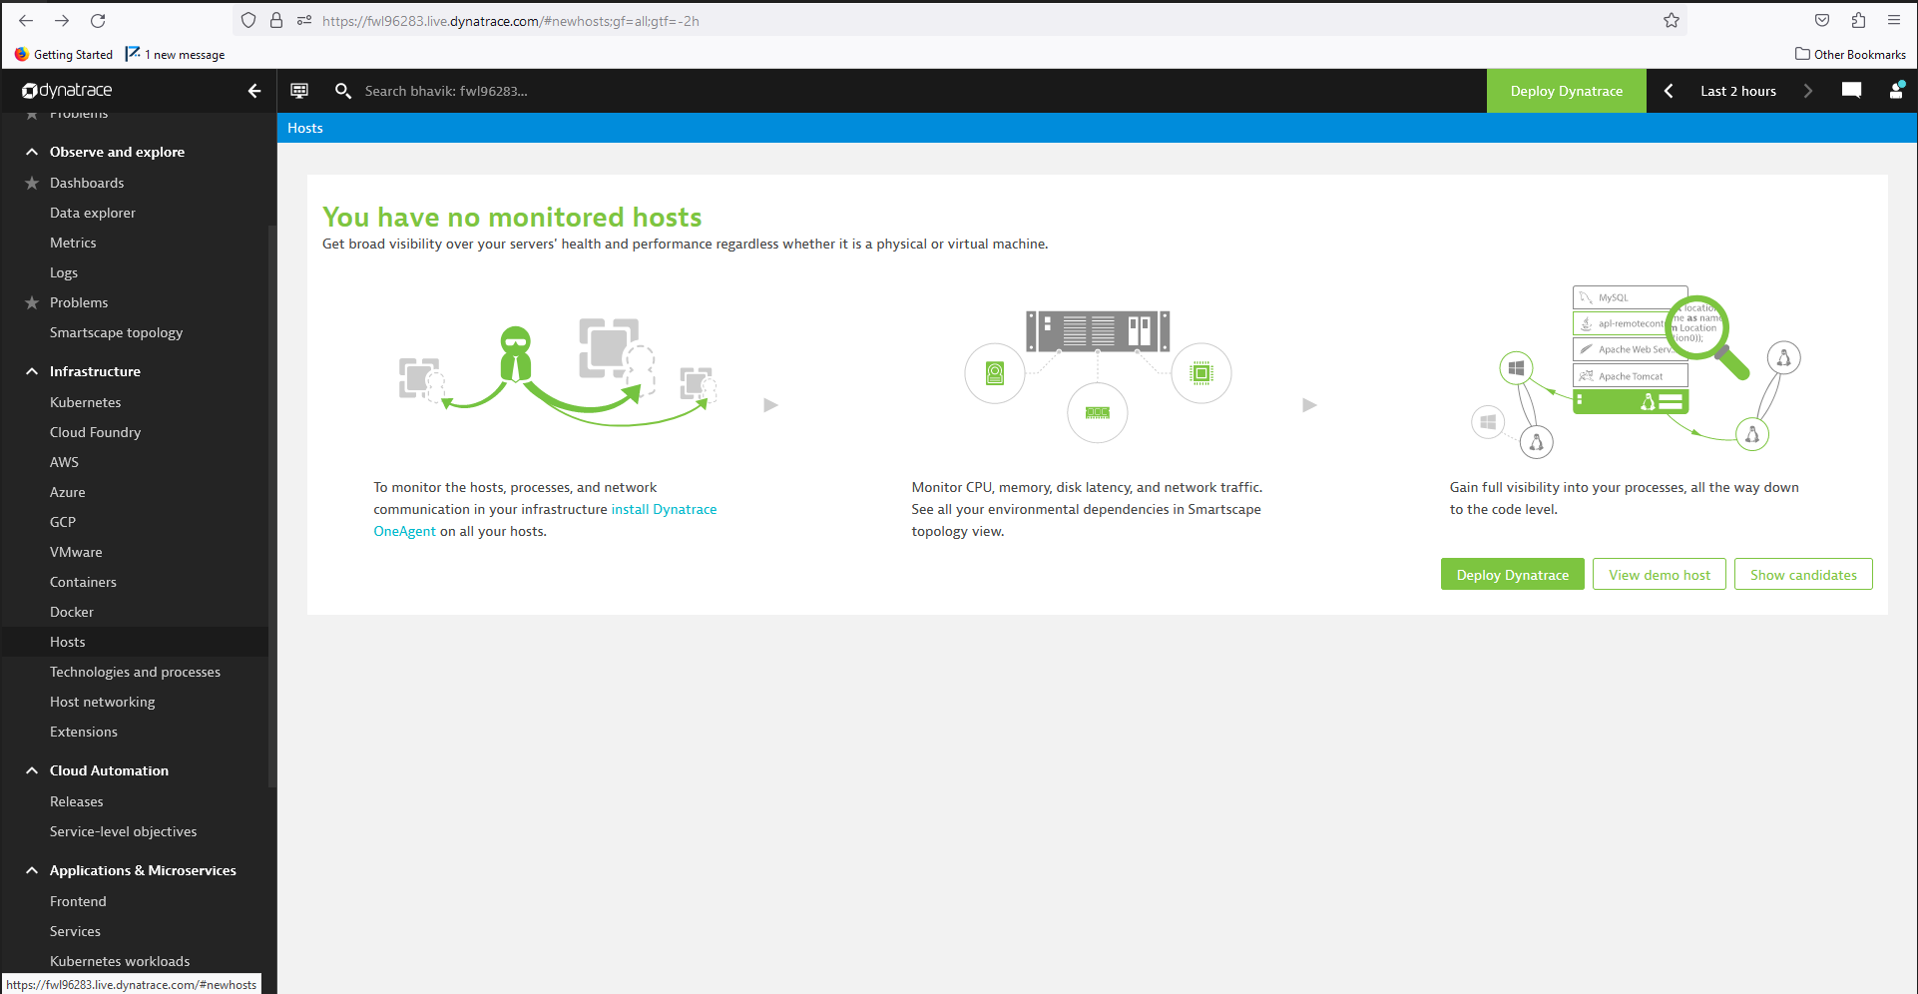
From your Dynatrace dashboard, navigate to > Infrastructure > Hosts.
From the available options, select Deploy Dynatrace.
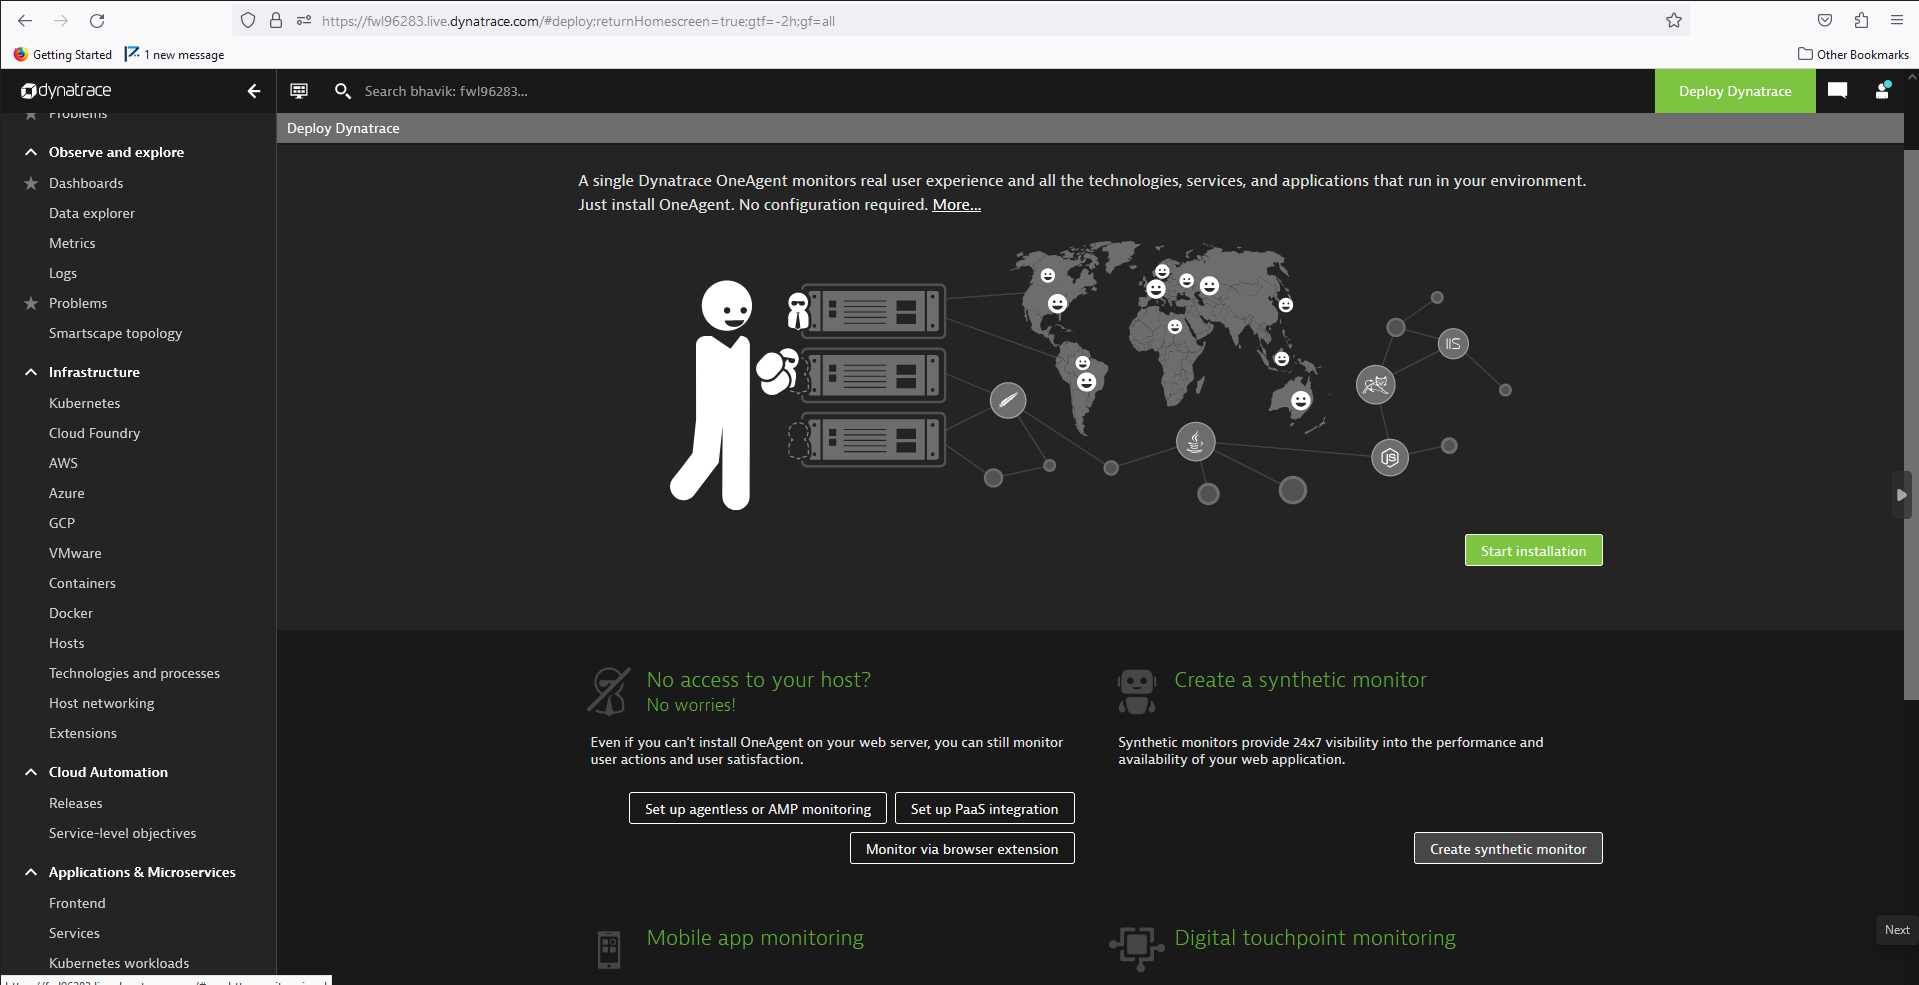
Select create synthetic monitor
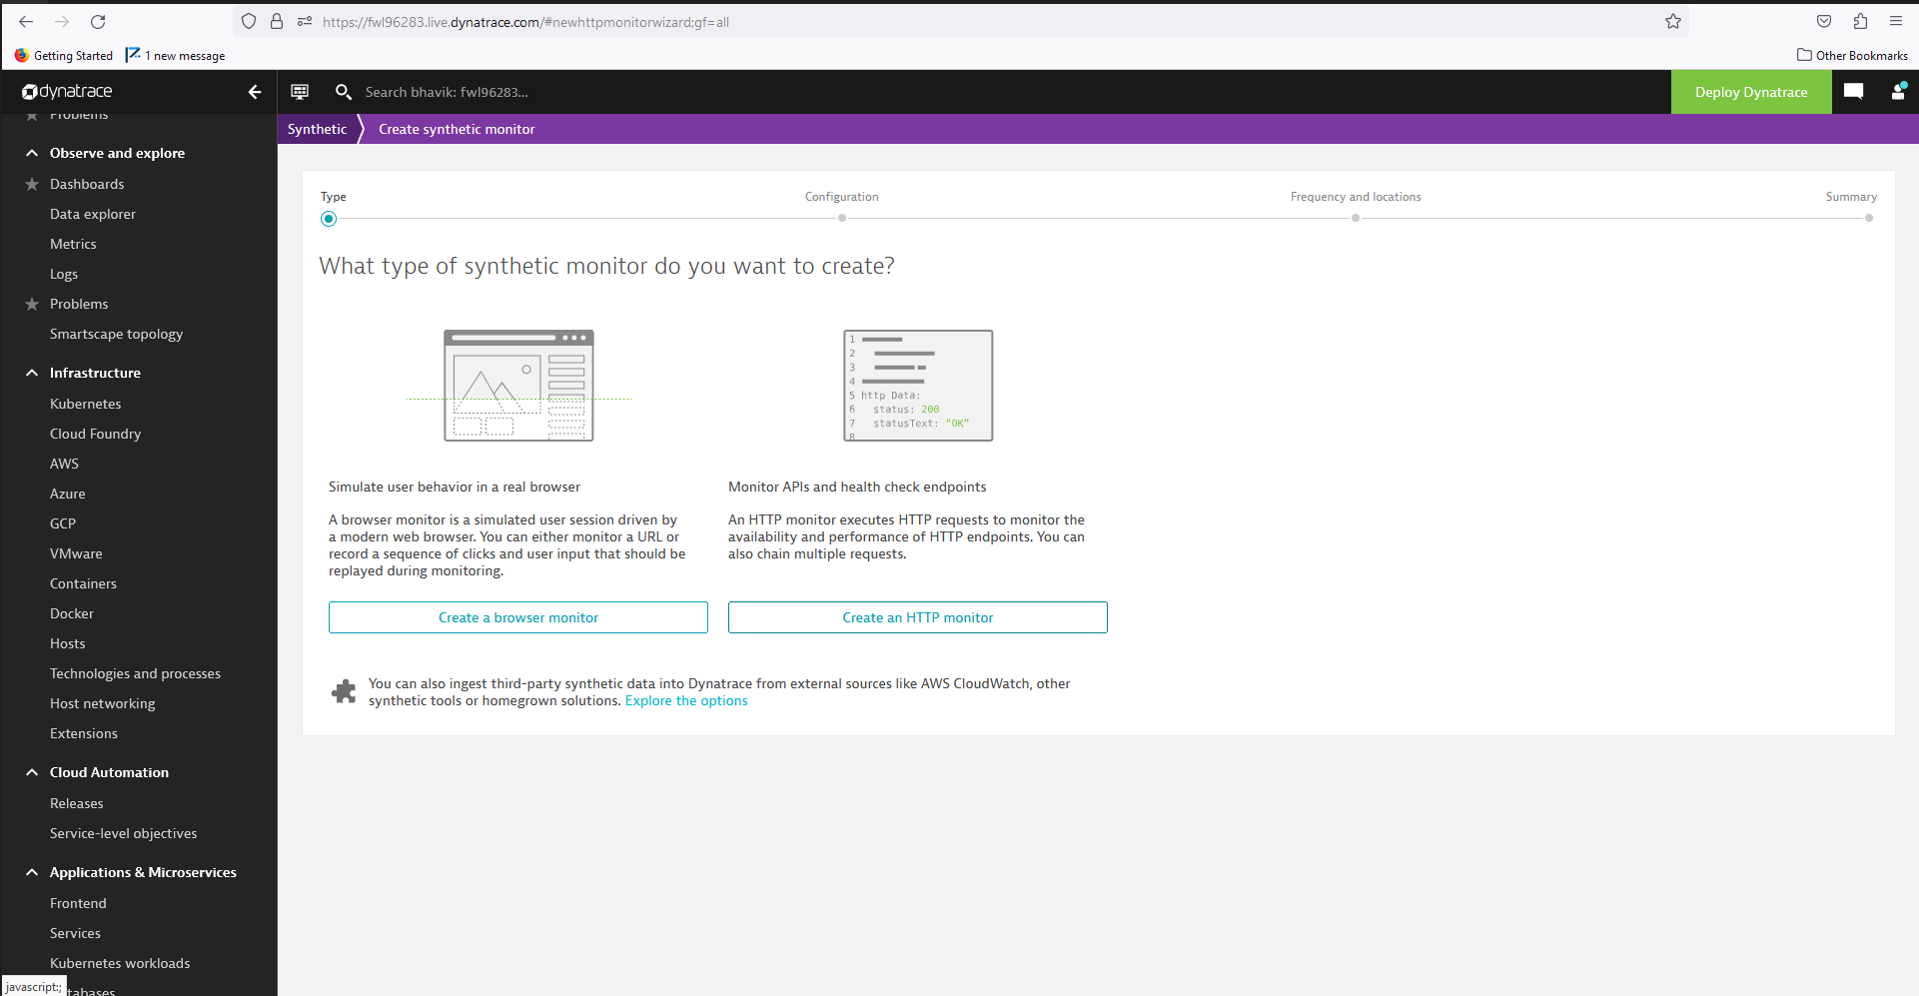
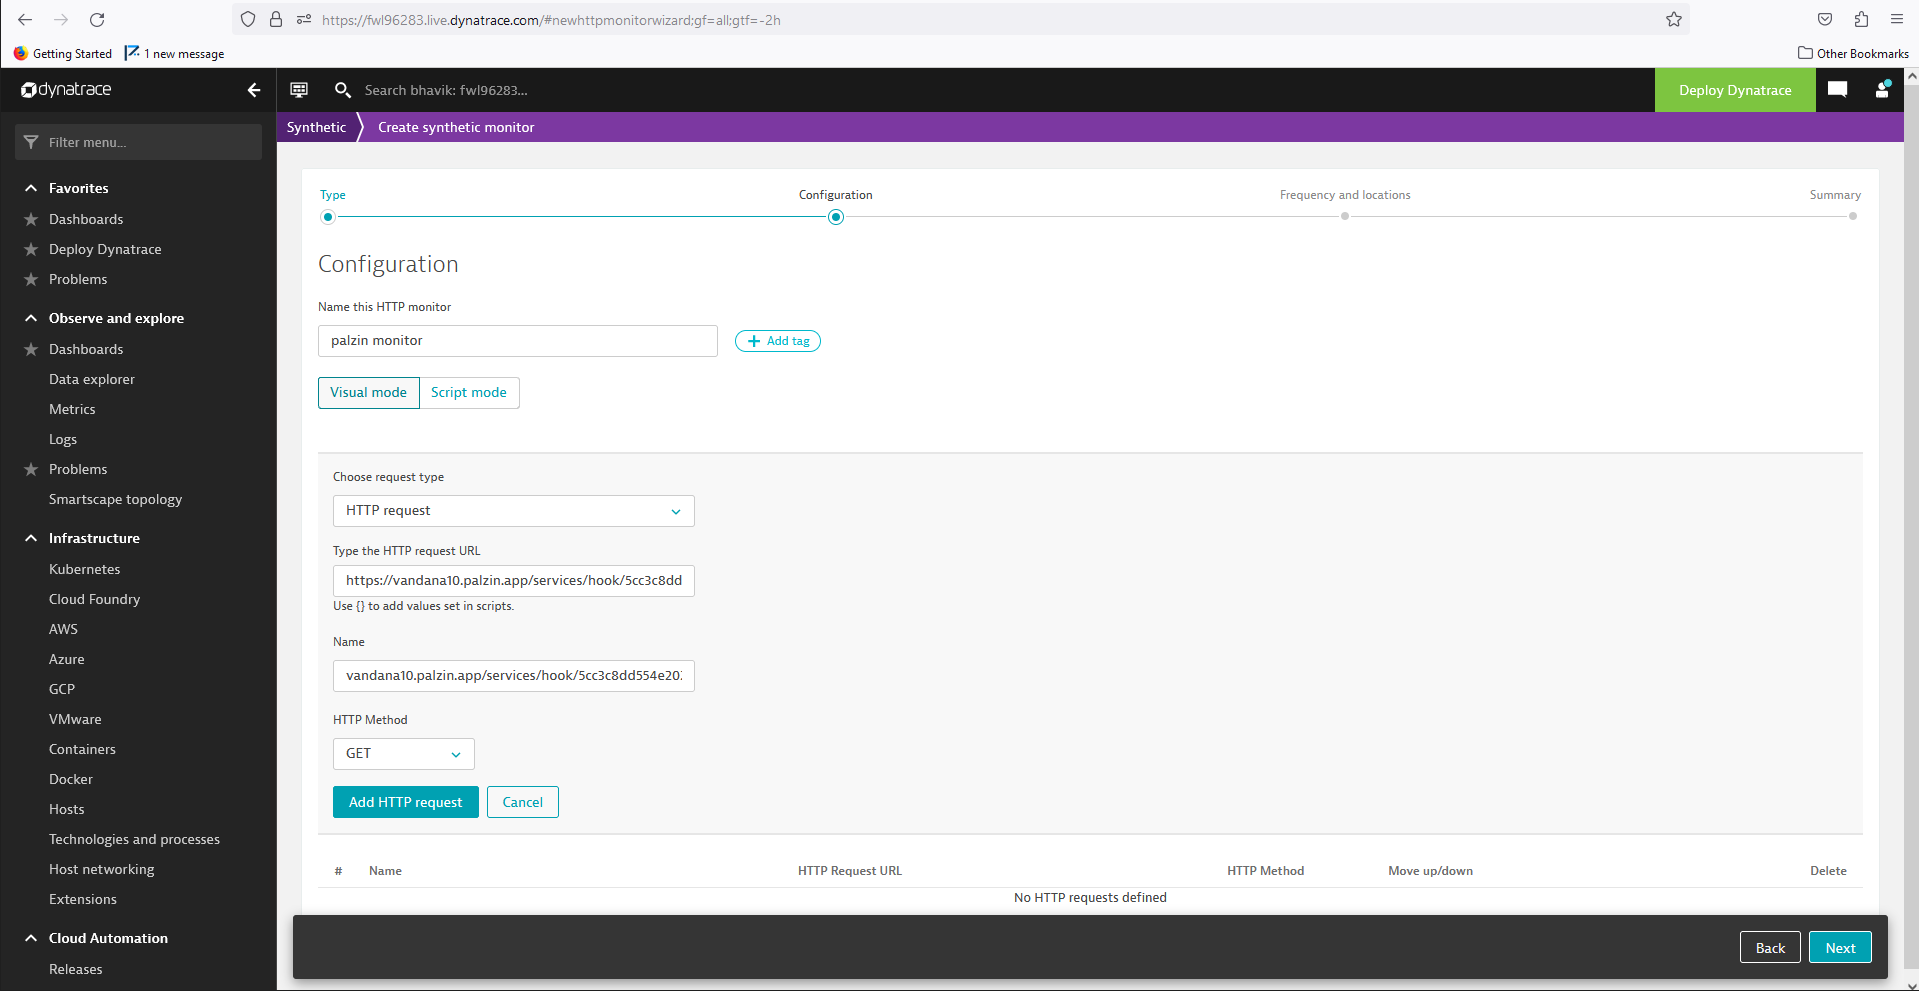
Click on Create an HTTP monitor
Copy URL from your palzin instance service view page.
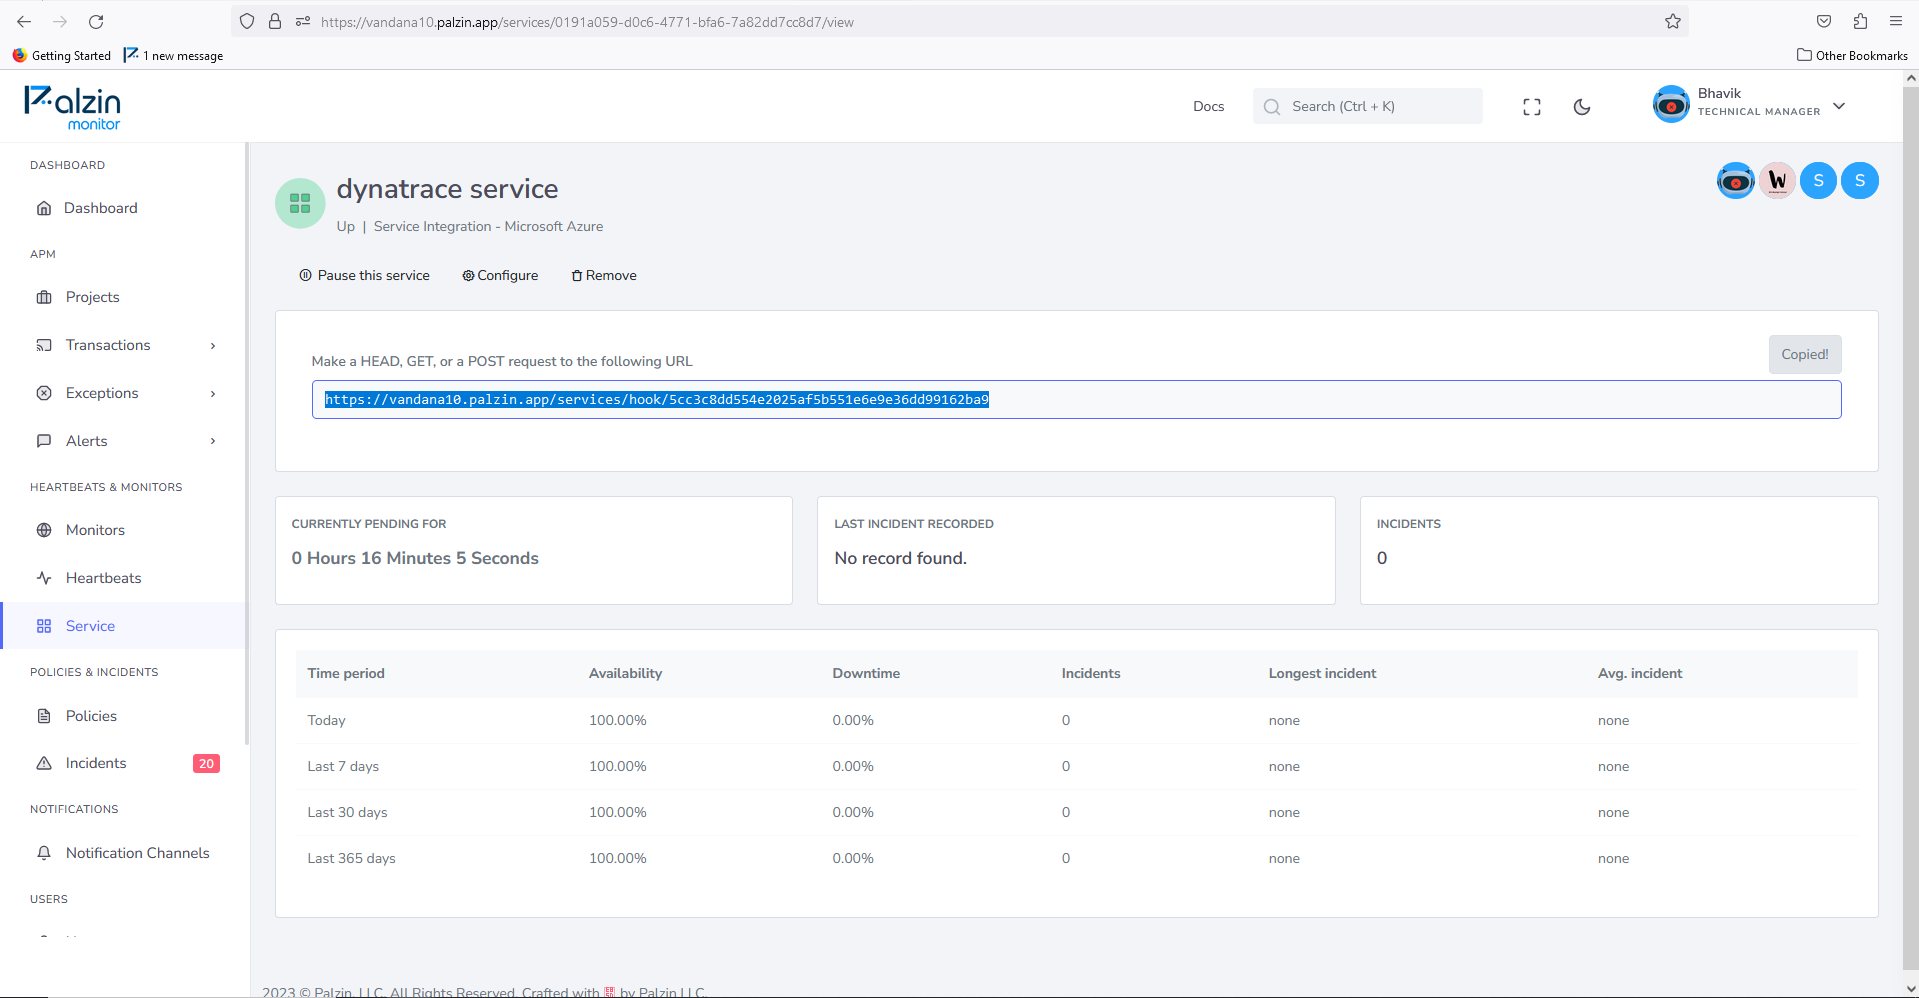
Paste the Palzin Monitor webhook URL.
Click on Add HTTP request.
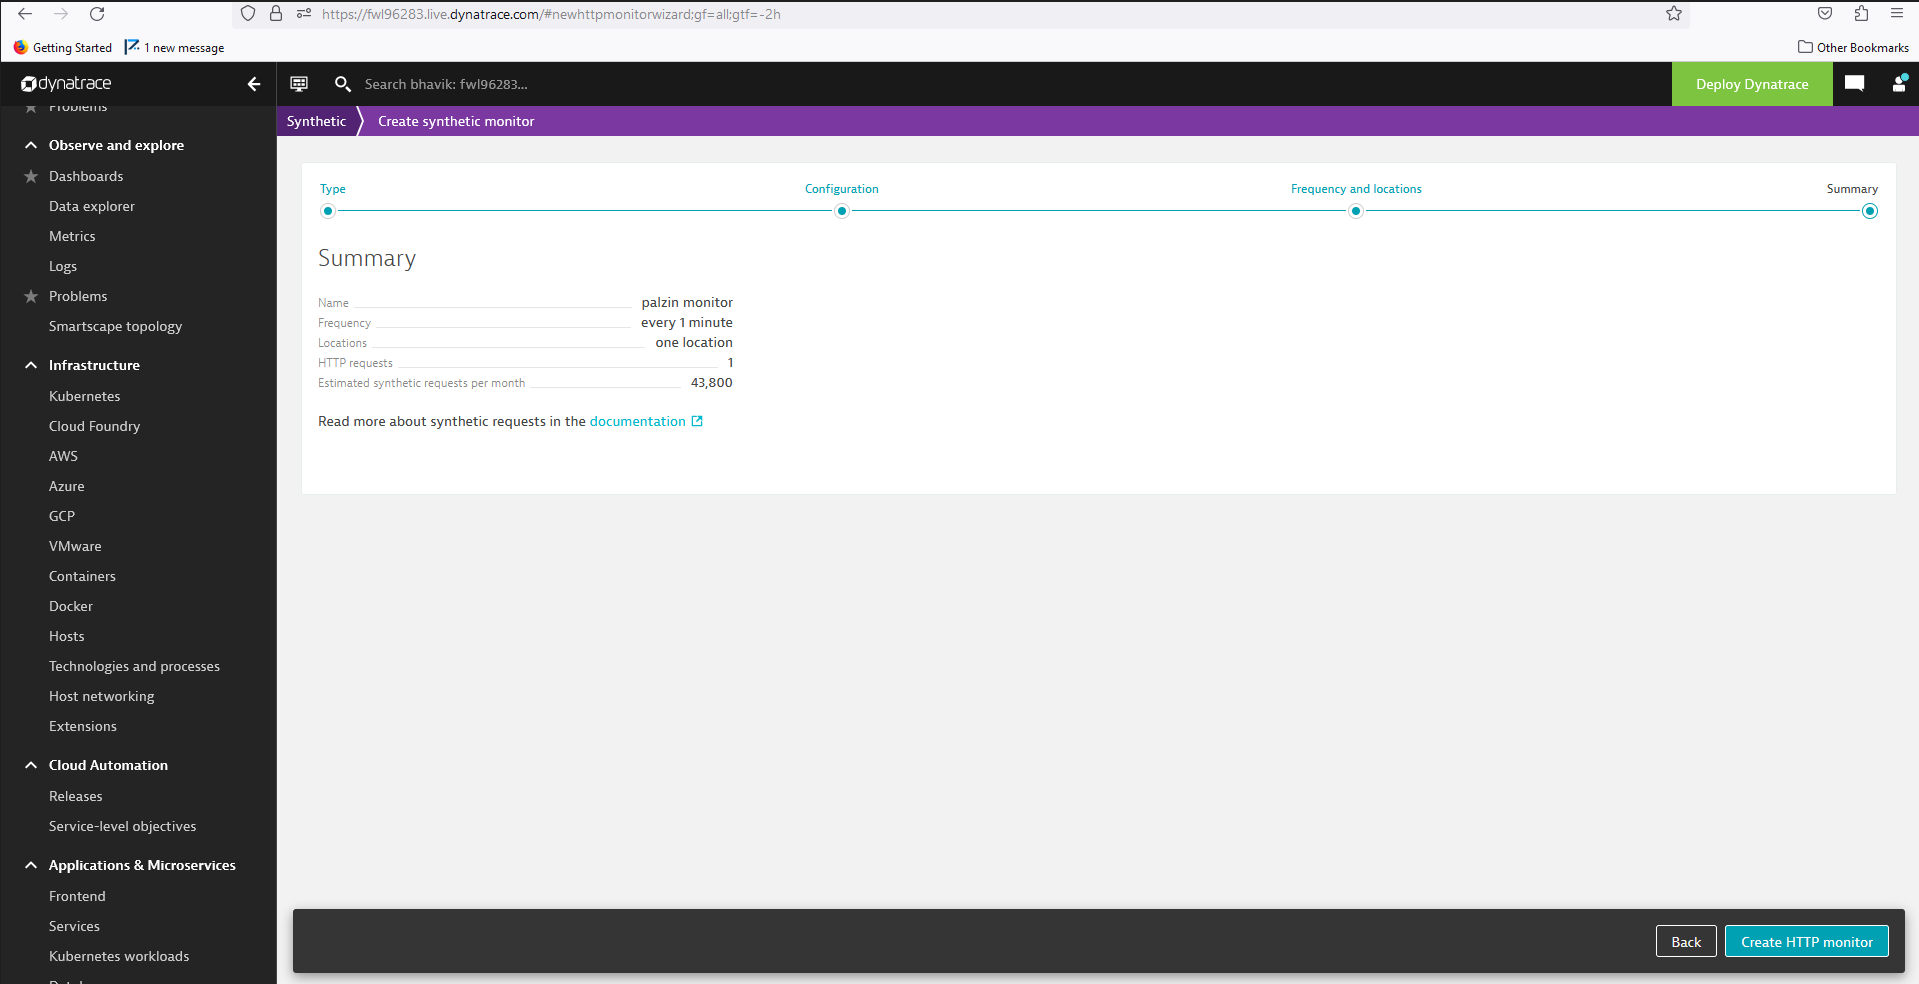
Click on Create HTTP monitor.
In your palzin instance, an incident will be created. That will contain these details.
{
    "State": "{State}",
    "ProblemID": "{ProblemID}",
    "PID": "{PID}",
    "ProblemTitle": "{ProblemTitle}",
    "ImpactedEntity": "{ImpactedEntity}",
    "ImpactedEntities": "{ImpactedEntities}",
    "ProblemDetailsText": "{ProblemDetailsText}",
    "ProblemSeverity": "{ProblemSeverity}",
    "ProblemURL": "{ProblemURL}"
}
It takes less than a minutes to setup your first monitoring.


