Make sure to add a LogDNA integration and copy the webhook URL. Follow the link below on instructions of how to create integration and service.
Create integration and service on our dashboard
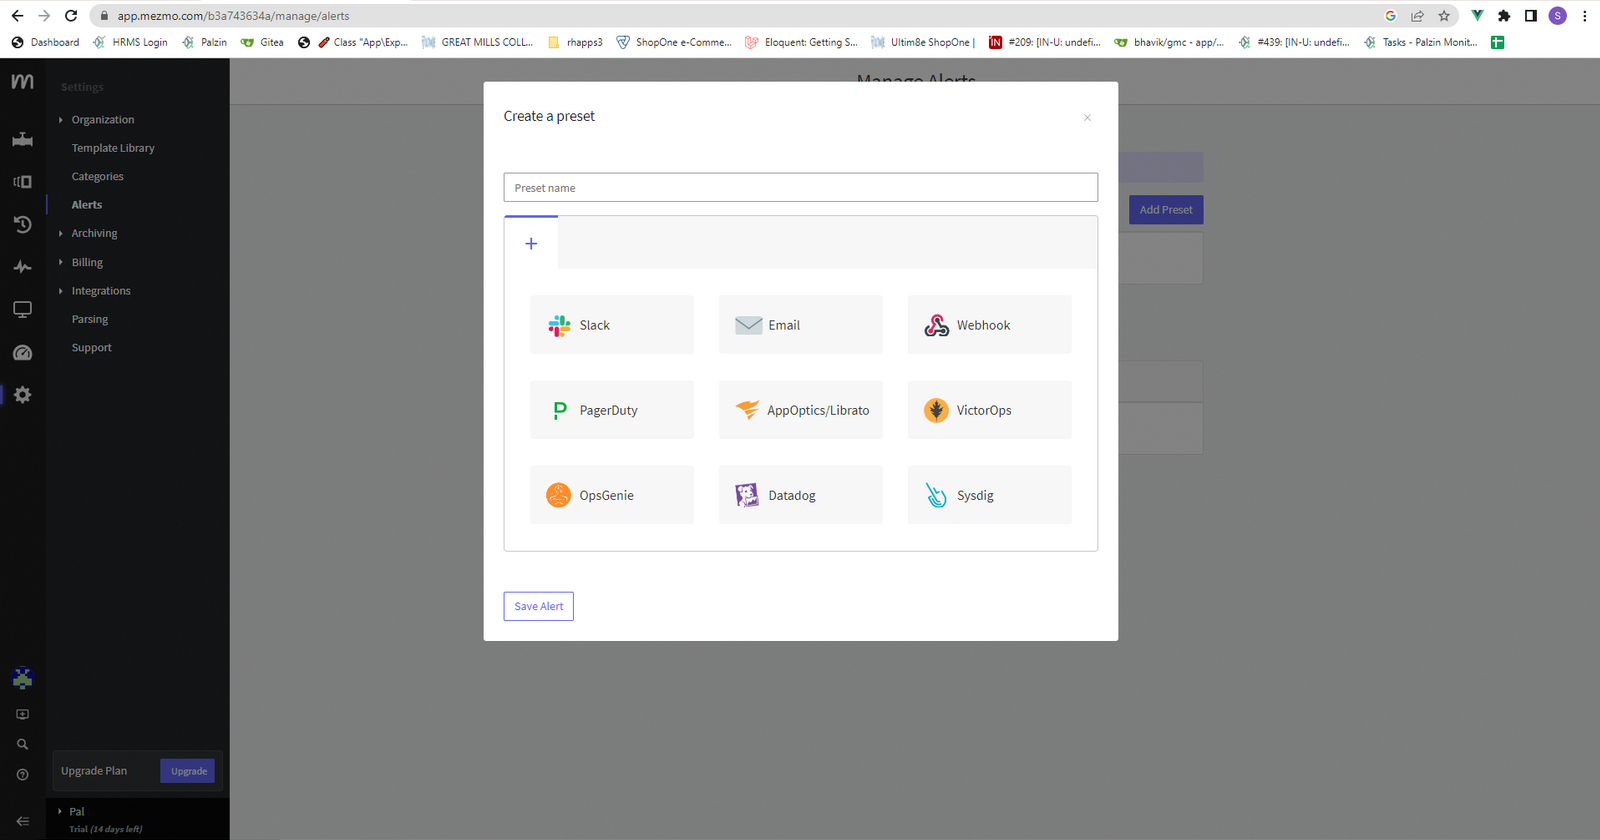
From the Settings tab, navigate to the alerts section. Then add a new Alert Preset.

Select webhooks from the available integrations and paste the Palzin Monitor webhook URL.
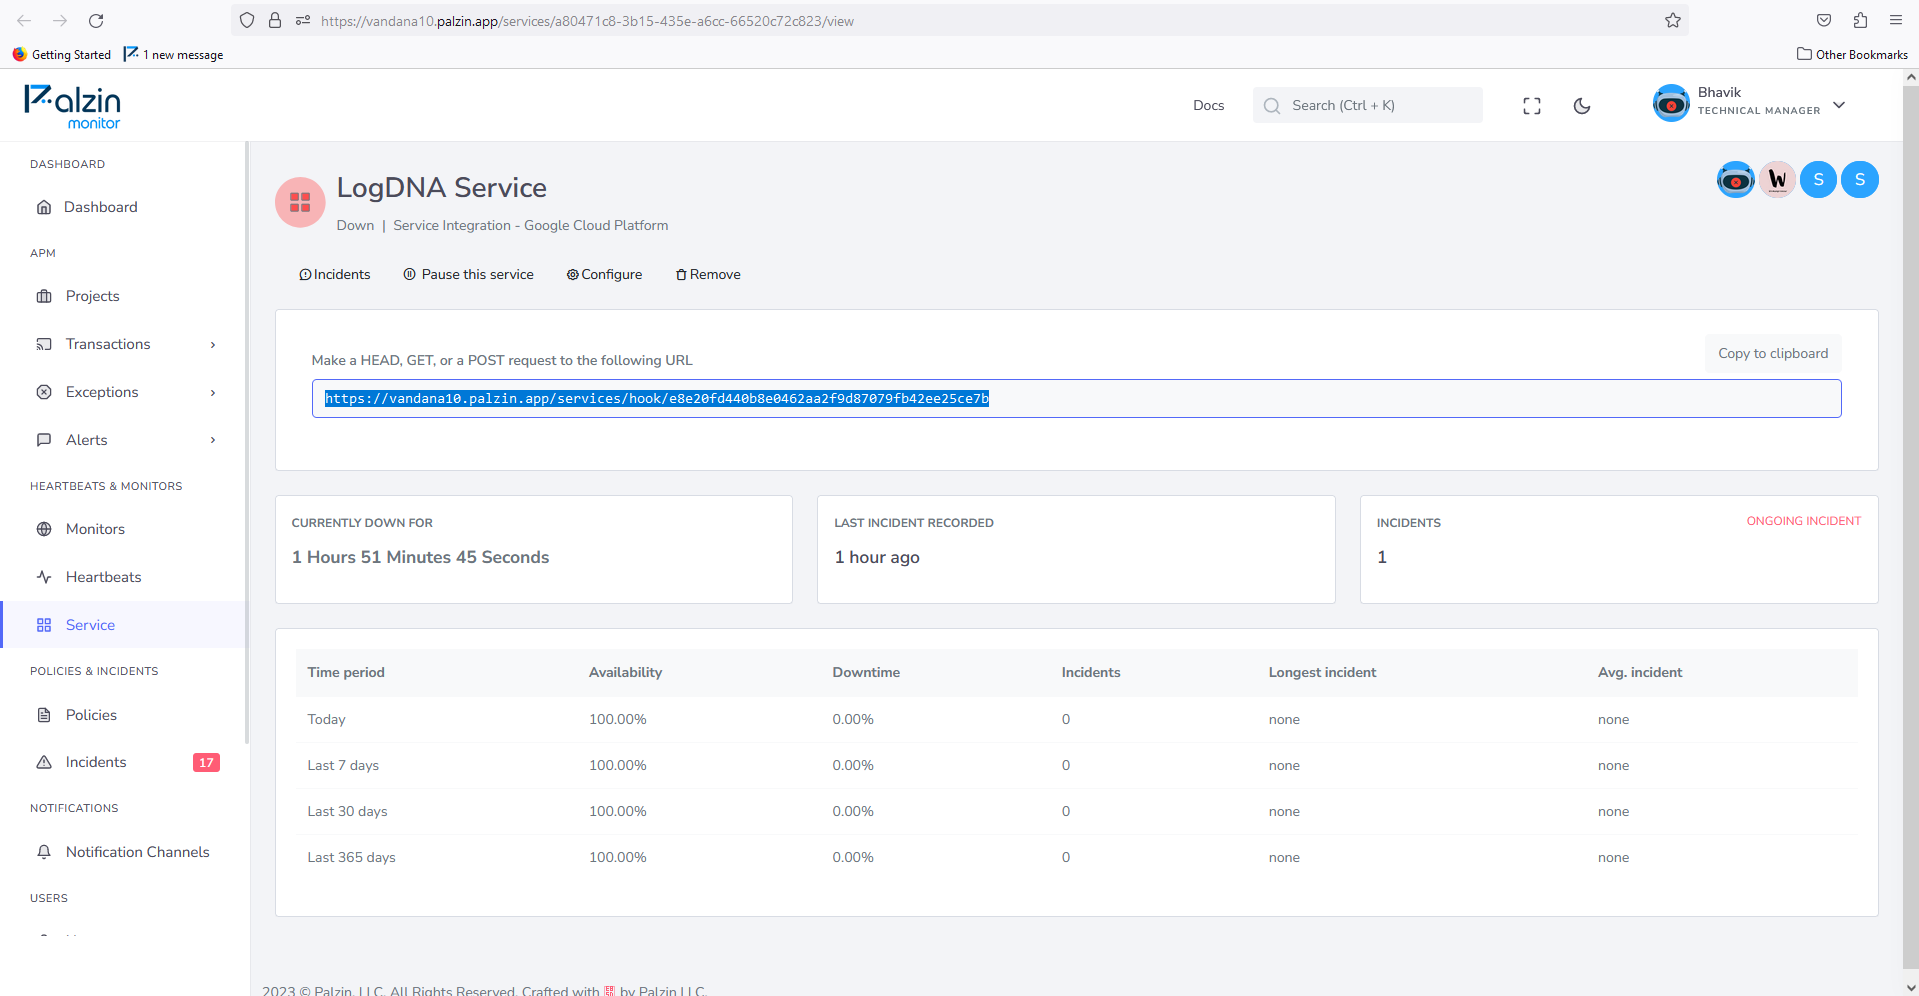
Copy URL from your palzin instance service view page.
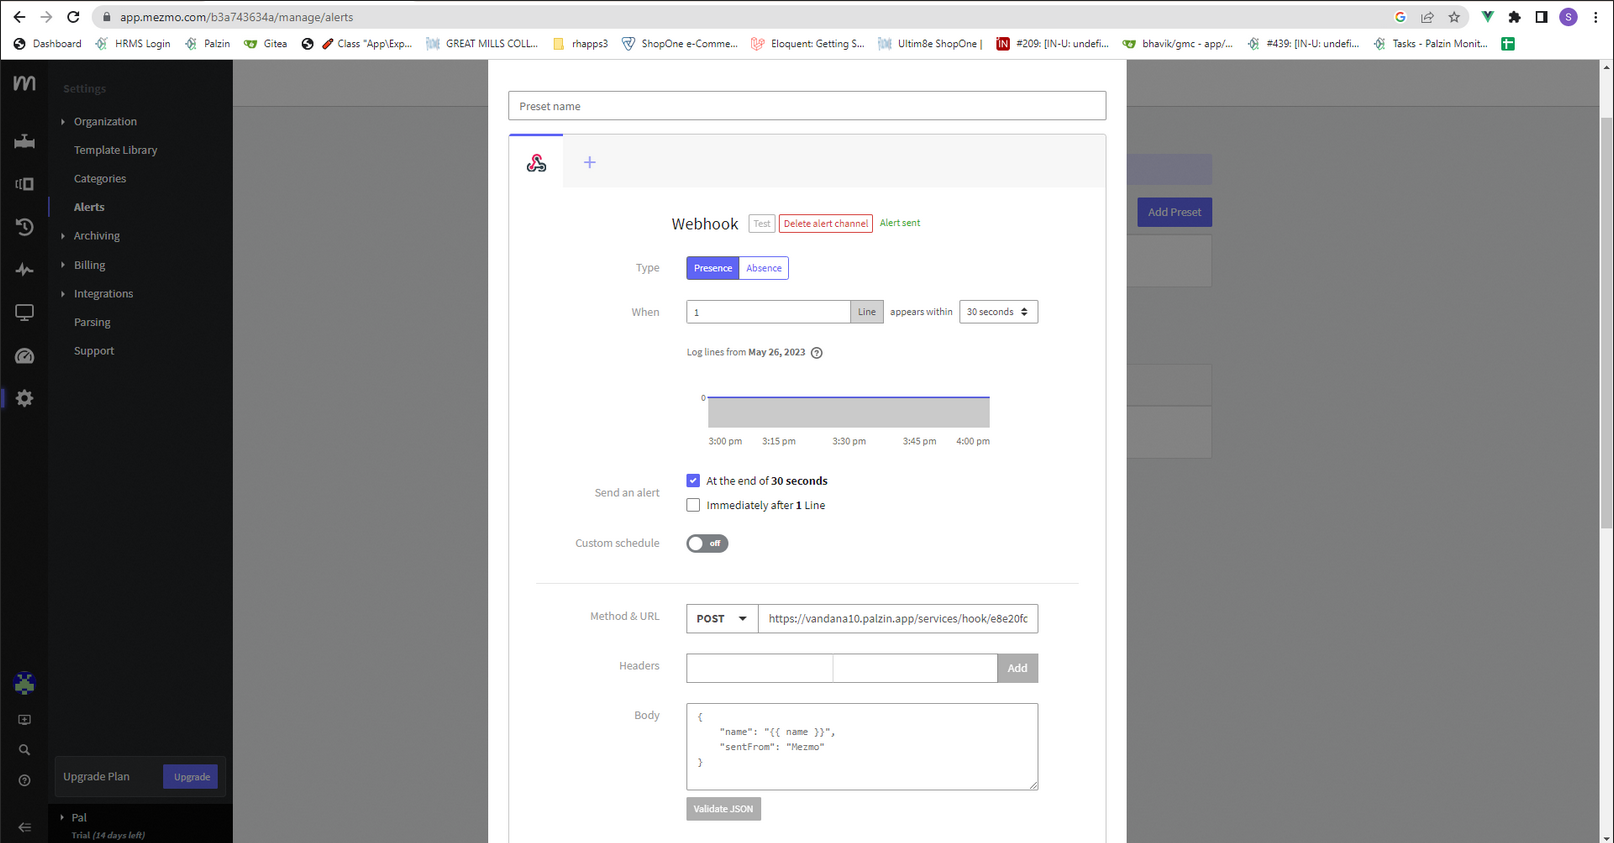
Fill the form and paste your integration's copied URL and paste it on LogDNA.
Then clik on Test.
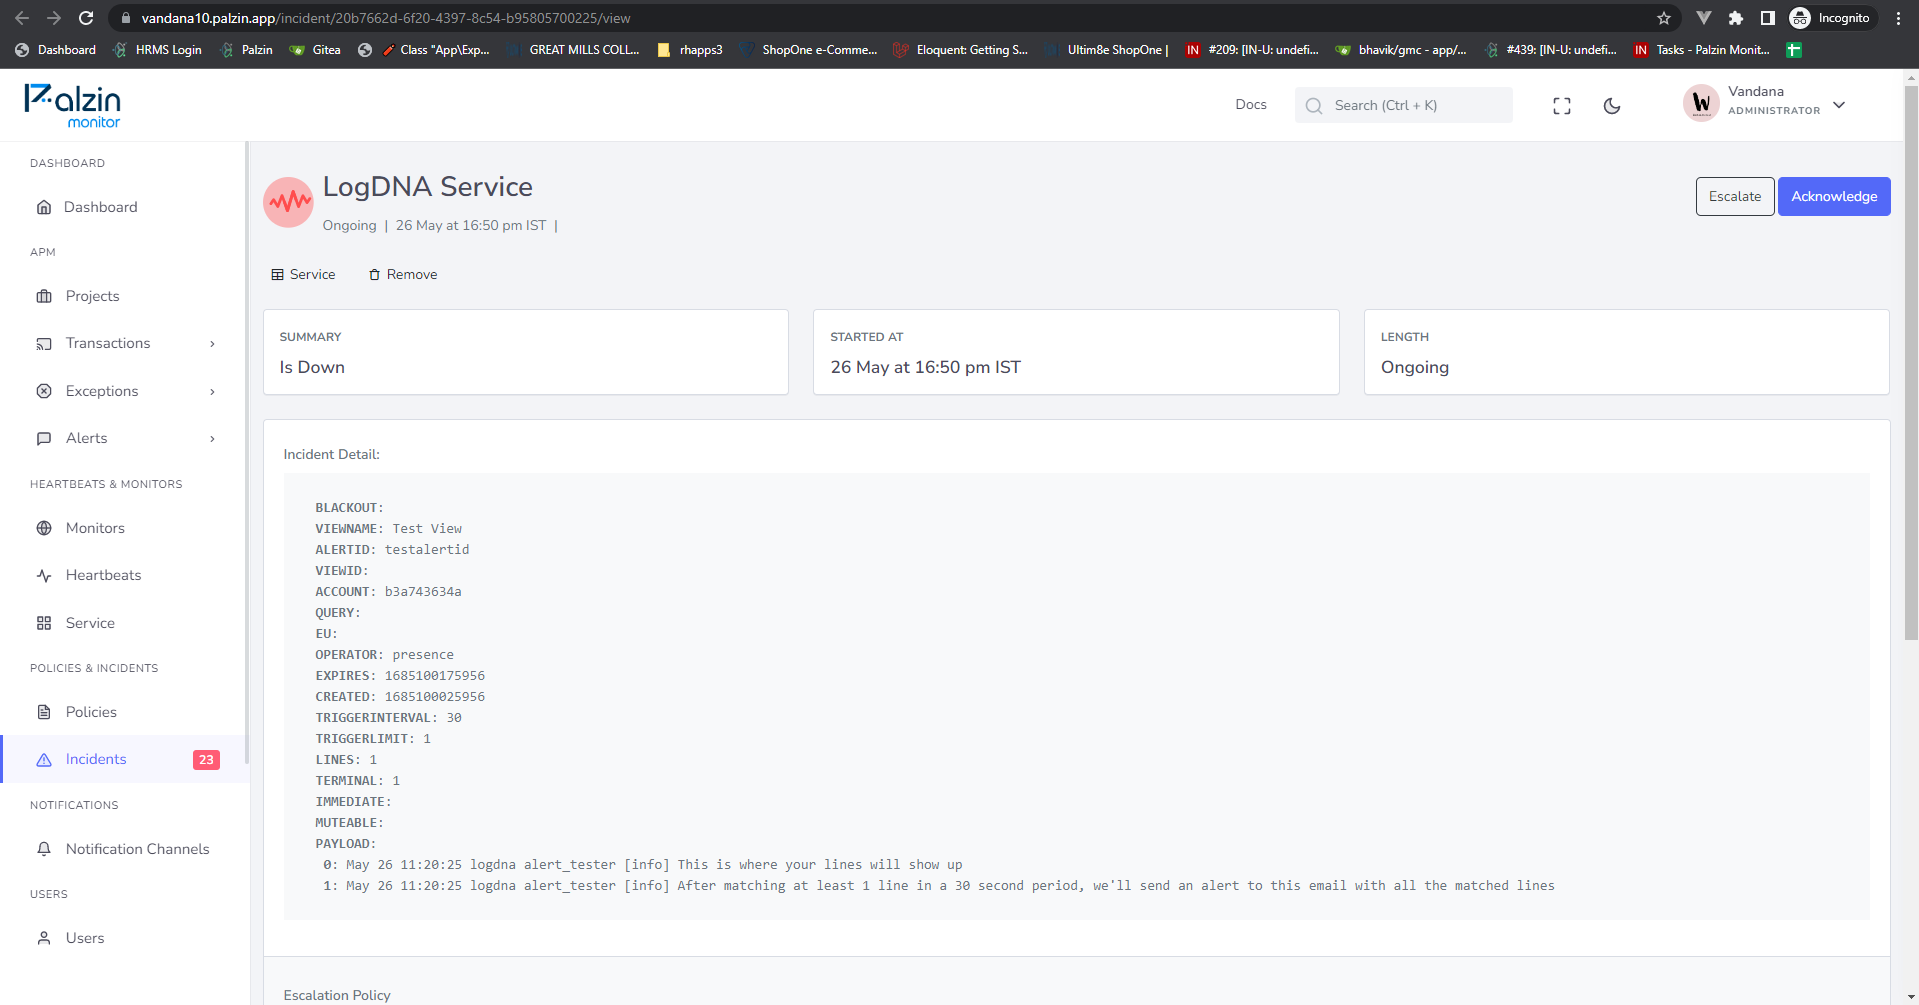
That's it. Your integration is ready to receive incidents.
In your palzin instance an incident will be created.
It takes less than a minutes to setup your first monitoring.


