Monitoring is an automated way of checking whether a service, such as a website or an application, is available. When a service goes down during an outage (downtime), uptime monitoring spots the issue and alerts the right person on the development team.
If this is your first time working with monitoring, we recommend starting with our Monitoring guide.
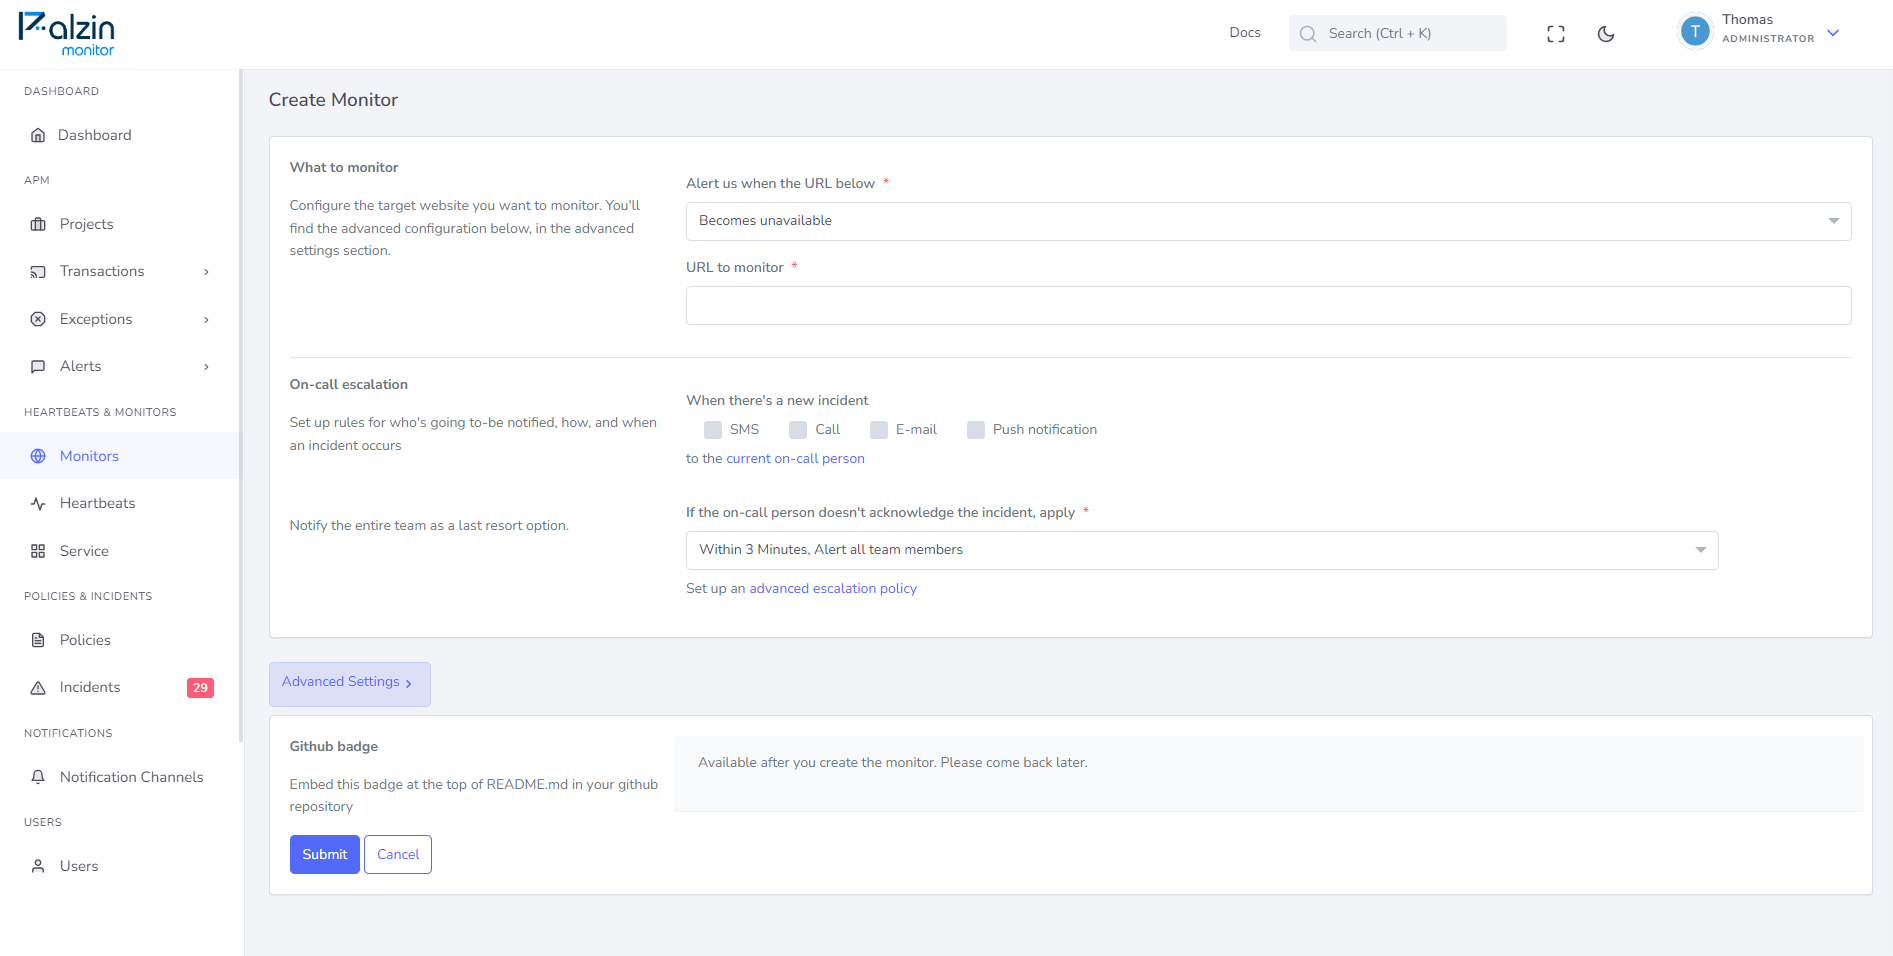
To start monitoring, we will create a monitor based on an HTTP status code and set up basic alerting, in case there is an incident.
An HTTP status code monitor checks your URLs every X seconds for an HTTP success status code (2XX). If the URL doesn't return this code, the monitor creates an Incident and alerts the current on-call person. If this person doesn't respond to the incident, an entire team is alerted.

Now that we have defined what the monitor will check, we need to define what happens when the check fails. Specifically, we need to set up who will get alerted and how. The alerting options we can choose from are:
Phone call — This is ideal for any vital business pages that need to be available 24/7. Phone calls are fully automated.
SMS — This is ideal for less critical alerts, such as low-traffic blog pages, or for use in combination with other alerting methods.
We recommend saving the Palzin Monitor phone numbers, so you know who is calling or texting you right away.
We recommend whitelisting the @palzin.app domain in your email client, so that incident alerts are marked as important. This will also prevent any important alerts from going into folders other than the main inbox.
Mobile app push notification — This is ideal as a secondary alerting method or in combination with other alerting methods. Push notifications are available for both iOS and Android. To set them up, go to Integrations → Exporting data, and you will find the installation guide under Mobile apps.
Slack, Microsoft Teams and other alerting integrations — These are great for any type of alerting and can smoothly integrate into your internal setup. Explore all alerting integrations by going to Integrations → Exporting data.
Choosing alerting and escalation options
This option is available in Uptime Monitor, DNS Monitor, Keyword Monitor, API Monitor, Ping Monitor, TCP/UDP Port Monitor and HTTP Status Code Monitor.
It takes less than a minutes to setup your first monitoring.