Make sure to add the Loggly integration and copy the webhook. Follow the link below on instructions of how to create integration and service
Create integration and service on our dashboard
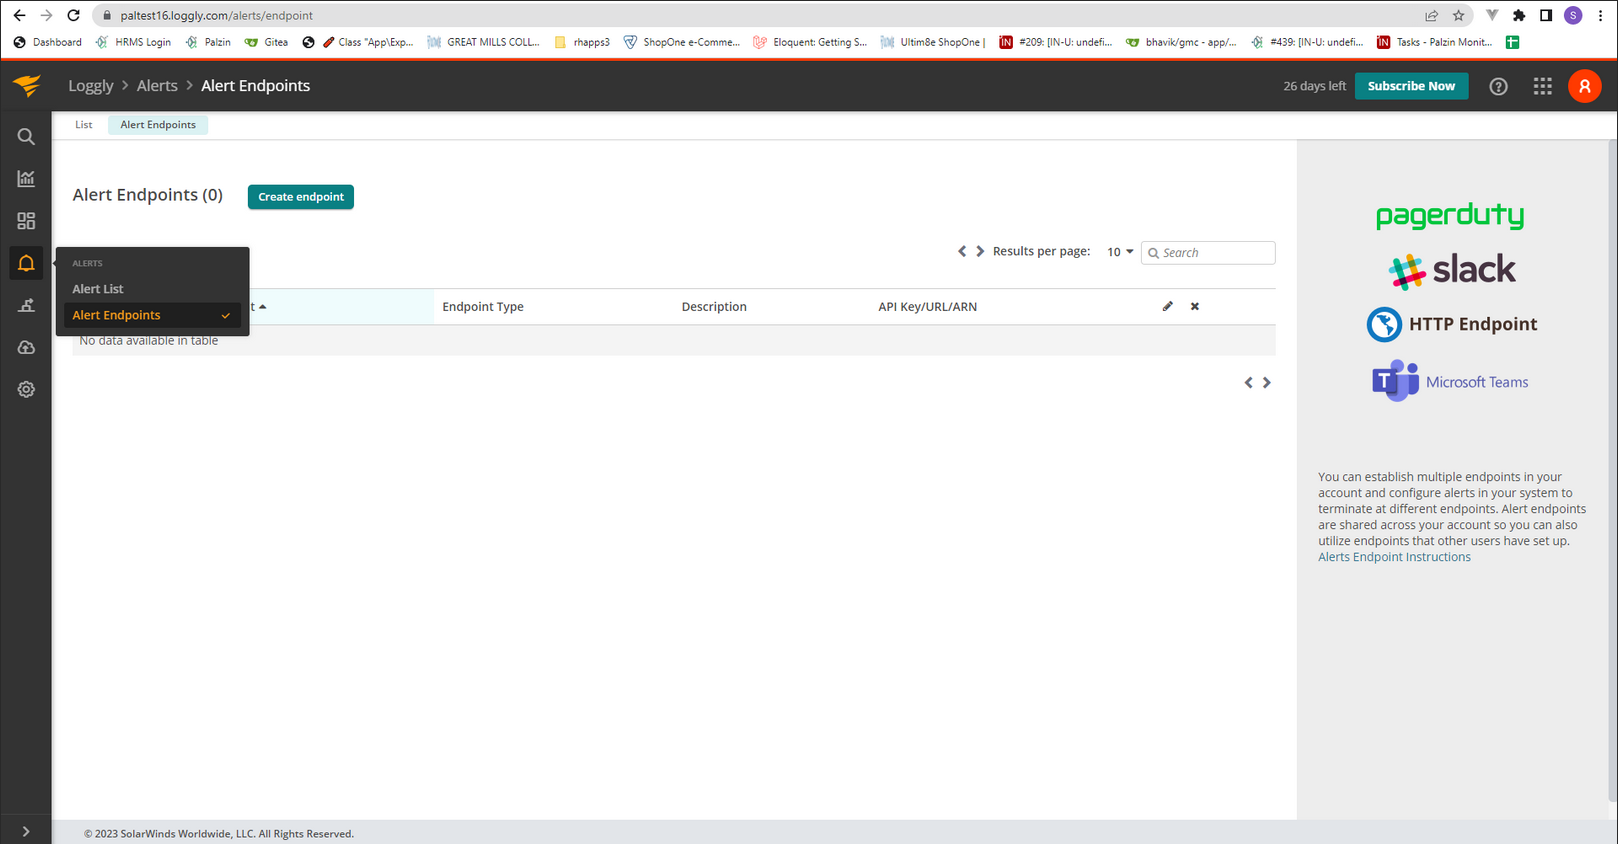
On the alerts page, navigate to the alert endpoints tab. Chooses create a new endpoint.

Create Endpoint
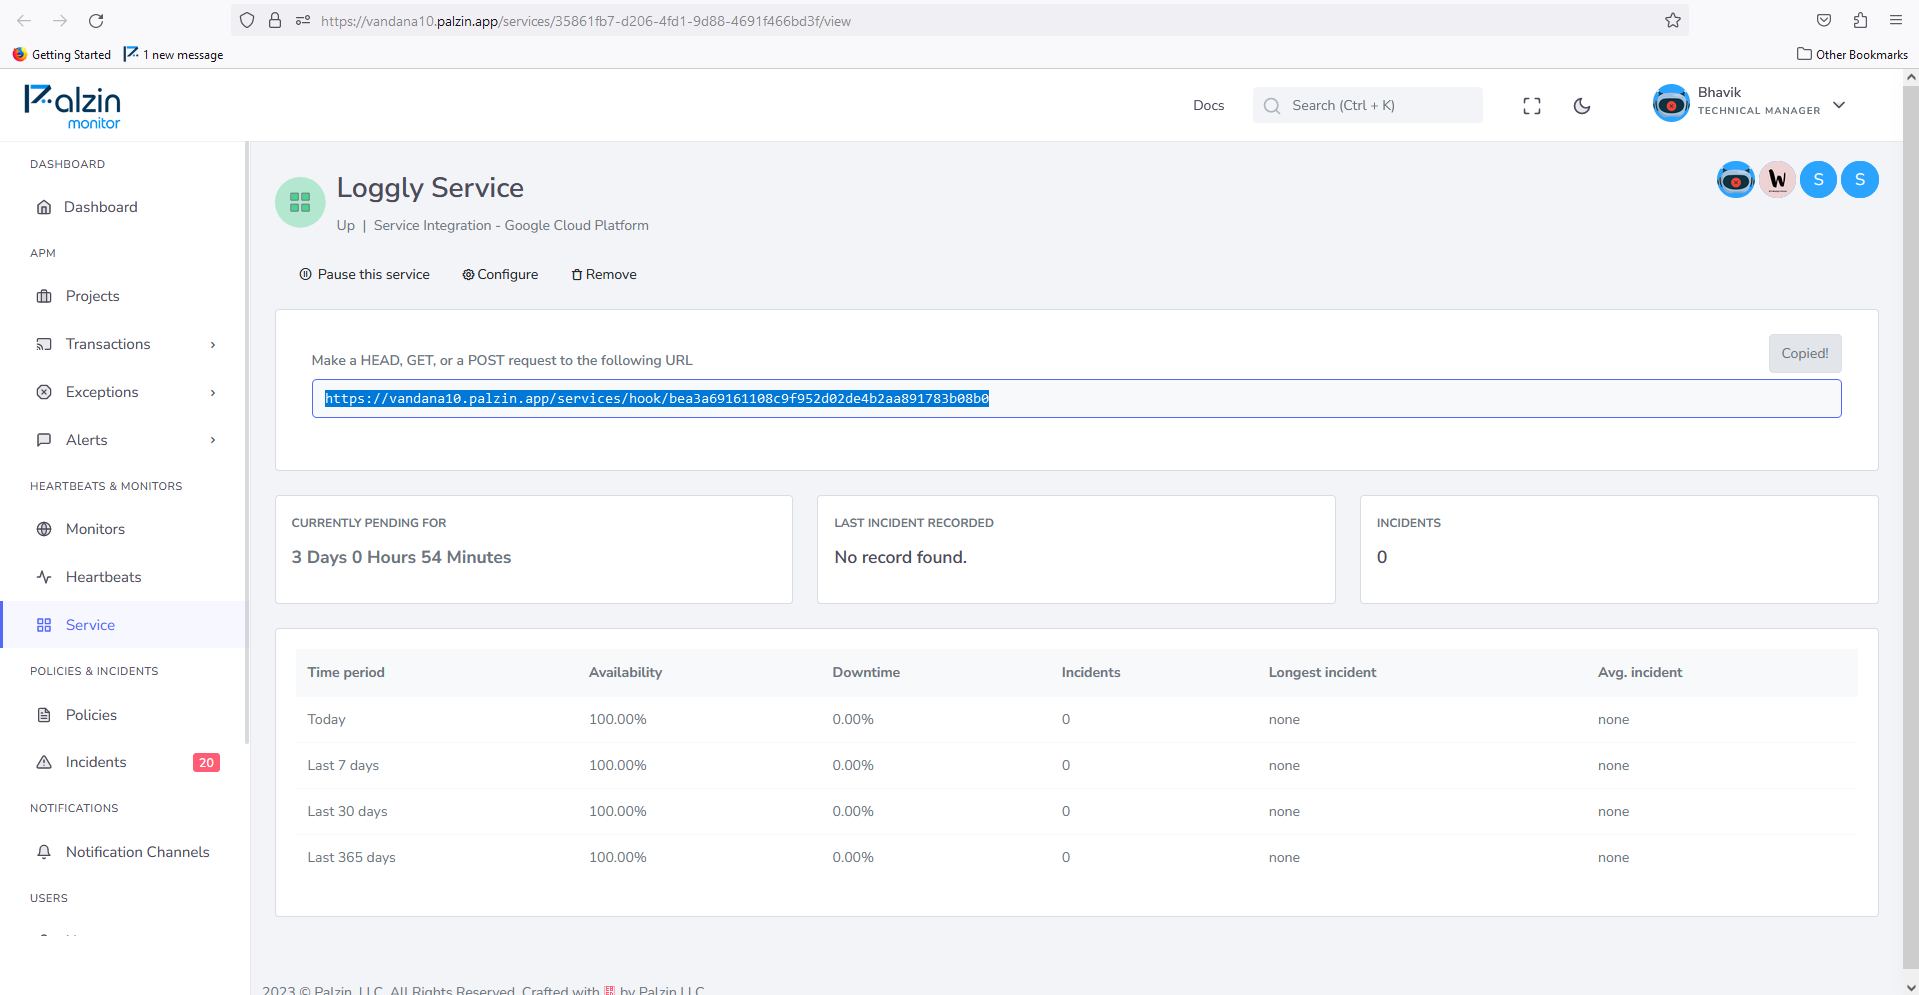
Copy URL from your palzin instance service view page.

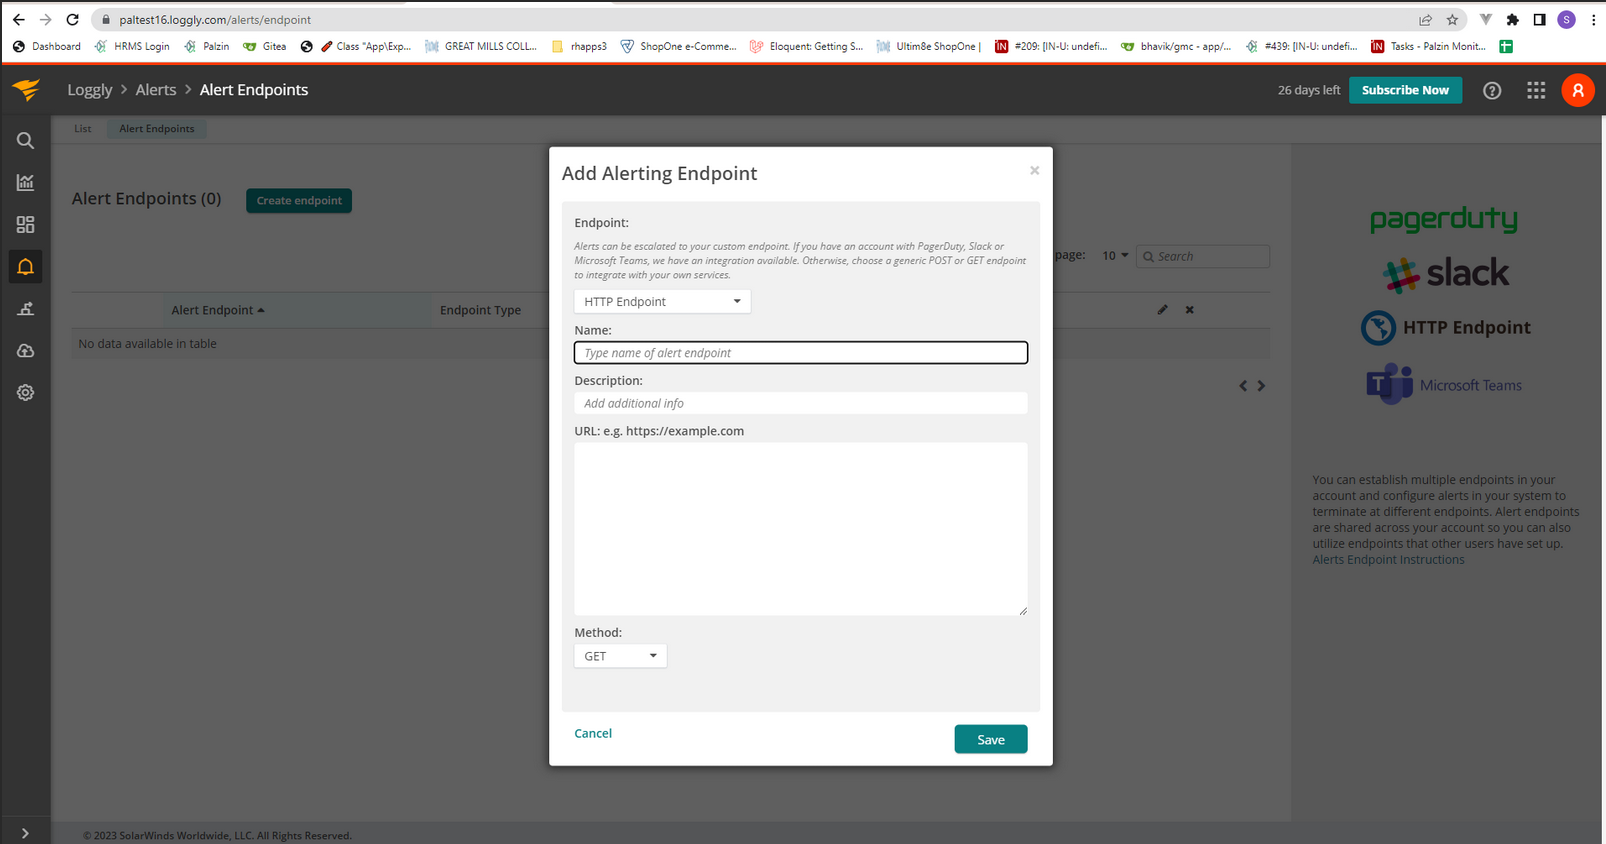
Select HTTP Endpoint from the dropdown.
Paste the Palzin Monitor webhook URL and select the method as POST.

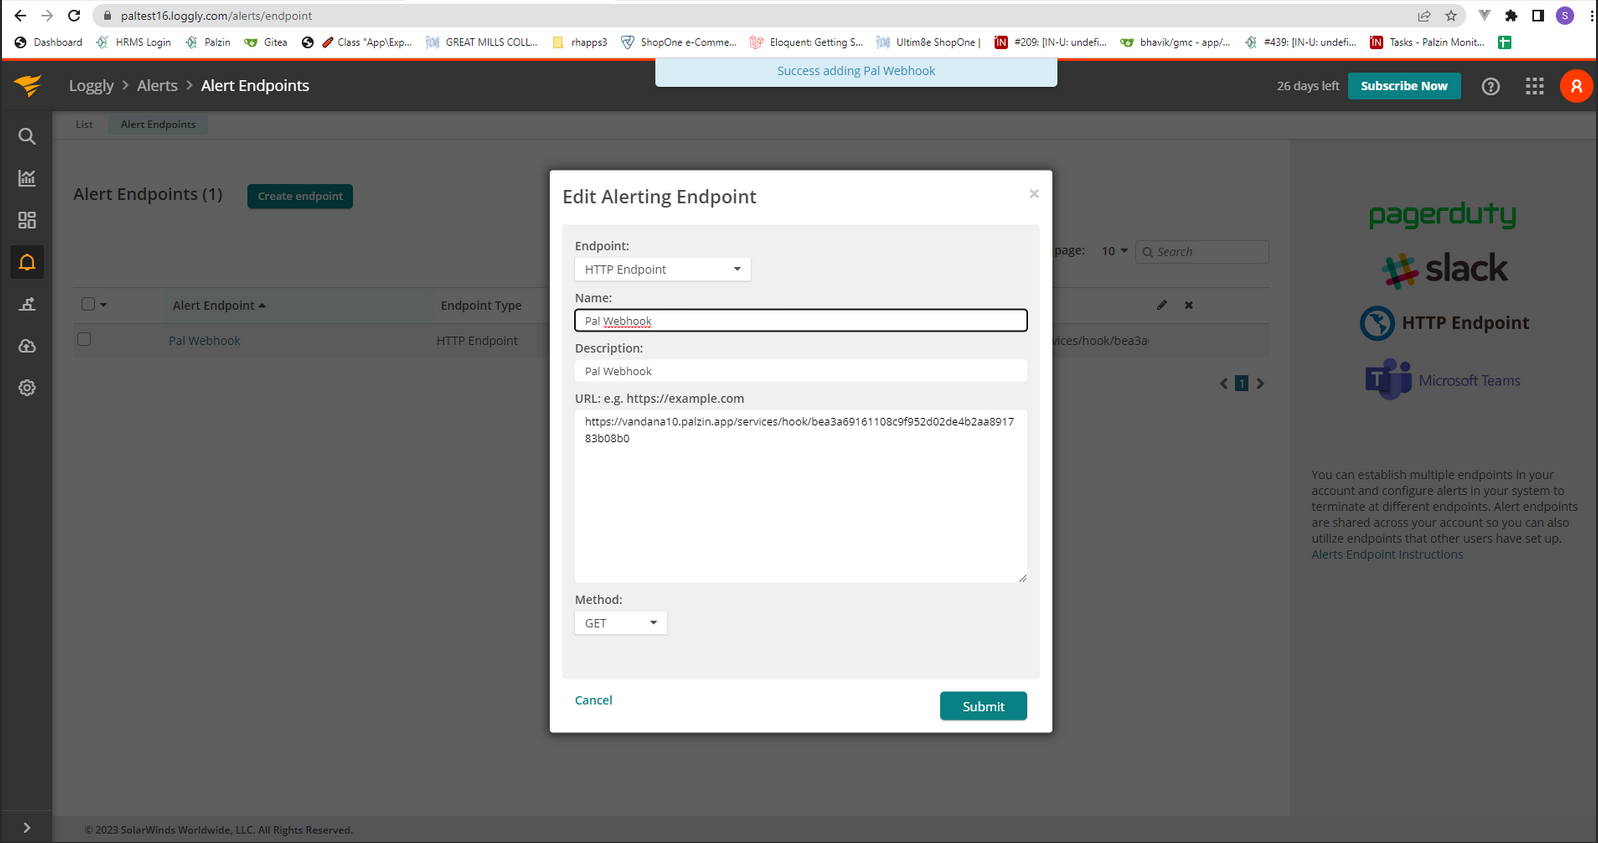
Your End point has been created.

In your palzin instance, an incident will be created. That will contain these details.
{
      "alert_name": "IndexOutOfBounds Exception",
      "edit_alert_link": "https://sample.loggly.com/alerts/edit/12345",
      "source_group": "N/A",
      "start_time": "Mar 17 11:41:40",
      "end_time": "Mar 17 11:46:40",
      "search_link": "https://sample.loggly.com/search/?terms=&source_group=&savedsearchid=1111111111&from=2015-03...",
      "query": "* ",
      "num_hits": 121,
      "recent_hits": [

      ],
      "owner_username": "sample",
      "owner_subdomain": "sample",
      "owner_email": "pm@loggly.com"
}
It takes less than a minutes to setup your first monitoring.