Palzin Monitor introduces Application Performance Monitoring (APM) capabilities, enabling you to monitor and optimize the performance of your applications. This guide will walk you through the essential features and steps to get started with APM in Palzin Monitor.
Palzin Monitor's APM goes beyond website monitoring to provide real-time performance monitoring, impact analysis, and optimization for exceptional user experiences.
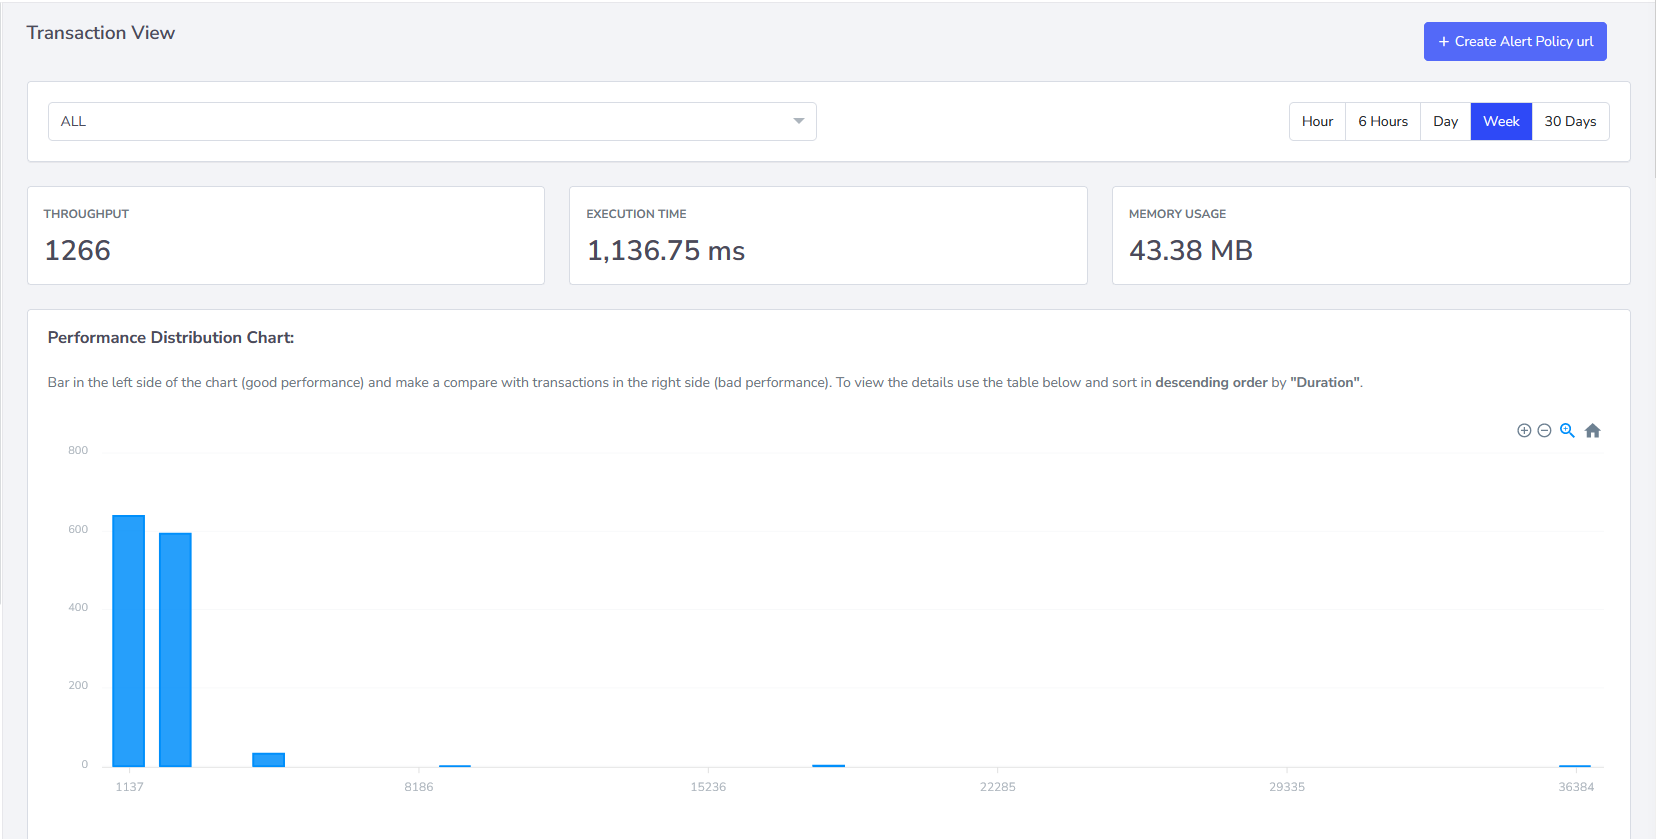
With Palzin Monitor's APM, you can easily identify application processes that have an impact on resource consumption, such as HTTP requests and background tasks. This feature helps you pinpoint areas of your application that require immediate attention.
The code execution timeline provides a visual representation of the execution flow within your application. By analyzing this timeline, you can identify tasks that can be optimized to enhance the overall efficiency of your application. It gives you a clear understanding of which statements have the most impact within each process.
Palzin Monitor's APM offers a quick and efficient way to identify the differences between good and poor process performance. By utilizing this feature, you can save significant time in identifying and resolving specific parts of your code that are causing performance degradation.
With real-time diagnosis, including error context and timeline, Palzin Monitor's APM helps you eradicate errors and their variants before your users become aware of them. By understanding the exact line of code causing the issue, you can proactively fix your application, minimizing negative impacts on your customer base.
Palzin Monitor's APM allows you to deliver important notifications through various channels. You can easily connect your monitoring system to notification channels such as Slack, Microsoft Teams, Email, Telegram, and Discord. By leveraging these integrations, you can create an automated and informed workplace, ensuring timely alerts to the right individuals whenever an issue arises.
To start using Palzin Monitor's for application performance monitoring, follow these simple steps:
Follow the instructions below to start utilizing the powerful capabilities of Palzin Monitor's Application Performance Monitoring (APM):
With Palzin Monitor's APM, you can gain valuable insights into your application's performance, streamline optimization efforts, and ensure a smooth and efficient user experience.
For more detailed information and advanced configurations, please refer to the comprehensive documentation available in the Palzin Monitor Knowledge Base.
Begin your Application Performance Monitoring journey today with Palzin Monitor and unlock the full potential of your applications.
It takes less than a minutes to setup your first monitoring.


