By default, Palzin Monitor (APM) automatically reports every unhandled exception, ensuring that you receive real-time alerts for unexpected errors.
In addition to automatically reporting exceptions, Palzin Monitor also provides the option to manually report an exception. This allows you to be aware of specific exceptions without blocking the execution of your code.
try {

    // Your code statements here...

} catch(LogicException $exception) {
    // Report an exception intentionally to collect diagnostics data
    ultimate()->reportException($exception);
}
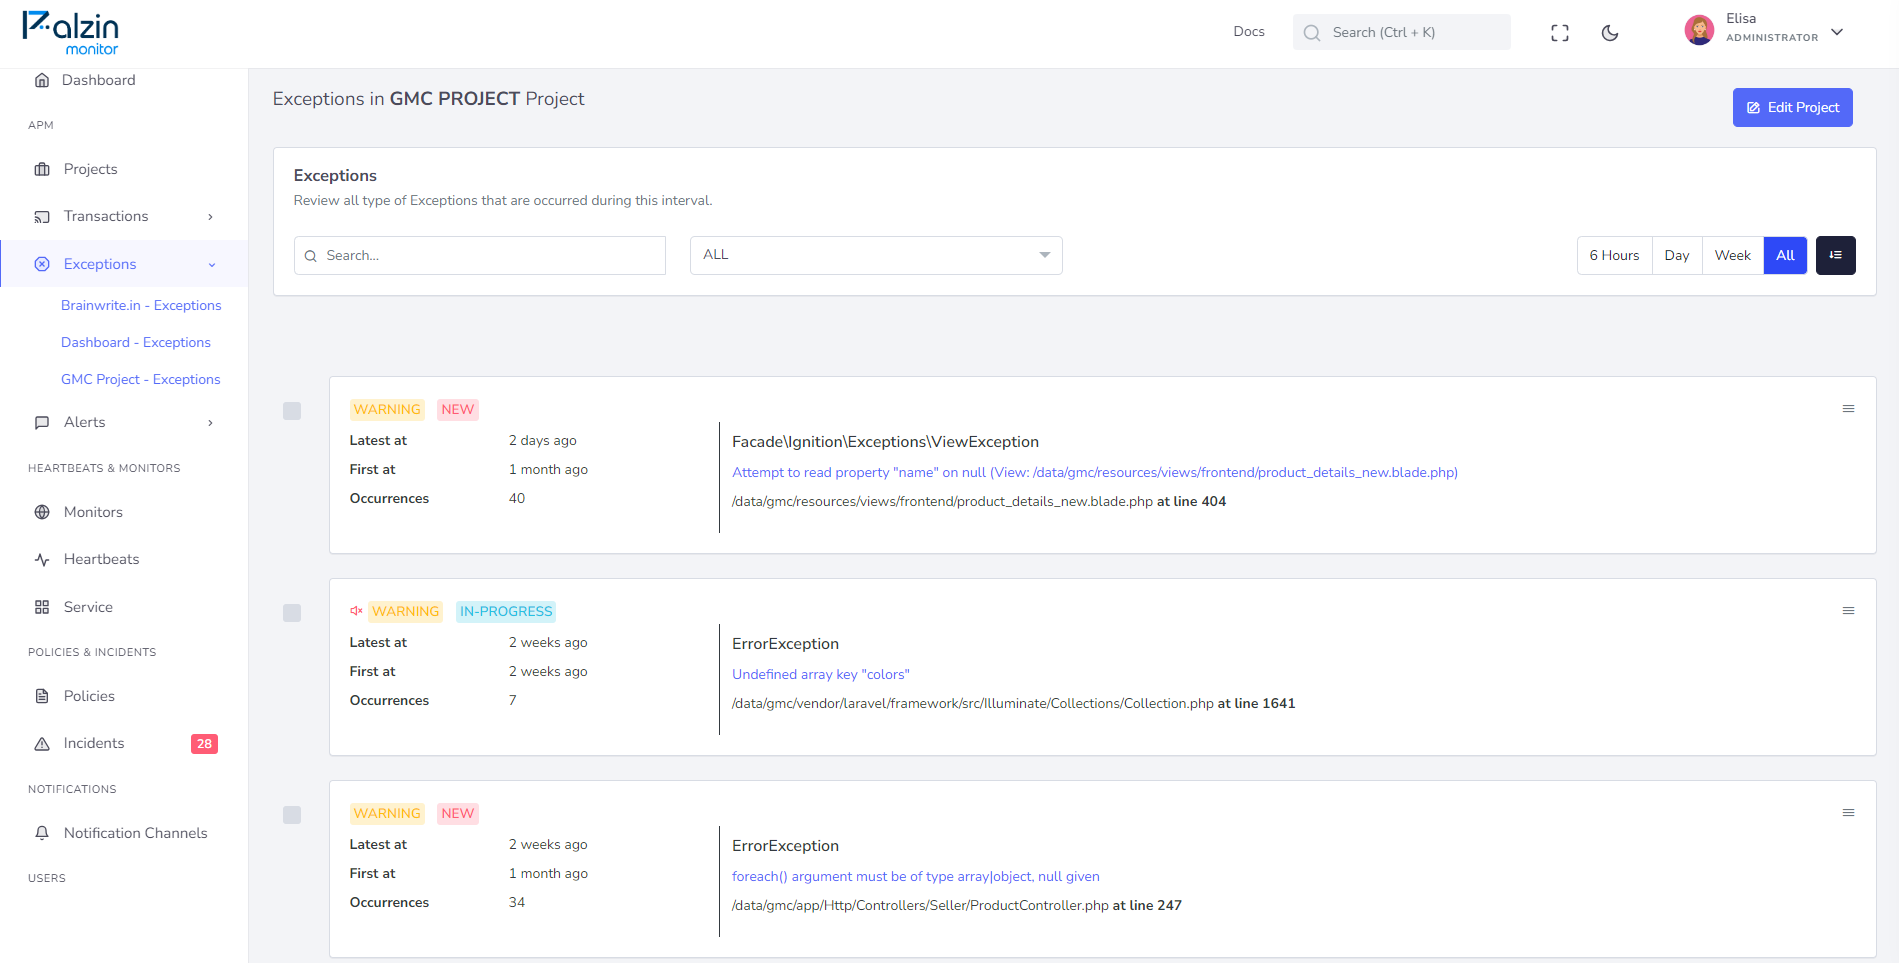
If any issues occur in your code, you will receive real-time alerts in your inbox, ensuring that you are promptly notified of any exceptions. Furthermore, Palzin Monitor will continue to monitor and track subsequent occurrences of the exception for further analysis and investigation. This proactive approach allows you to stay informed about any problems that may arise within your codebase.
When an exception is detected, you can examine the code within the stack trace to gain insights into the specific portion of the code that triggered the exception. This information is valuable for understanding the context and identifying potential causes of the exception. Additionally, Palzin Monitor allows you to track the frequency of occurrences for a particular exception, enabling you to analyze patterns and trends over time. This monitoring capability aids in conducting thorough investigations and resolving any underlying issues in your codebase.
It takes less than a minutes to setup your first monitoring.


