Create integration and service on our dashboard
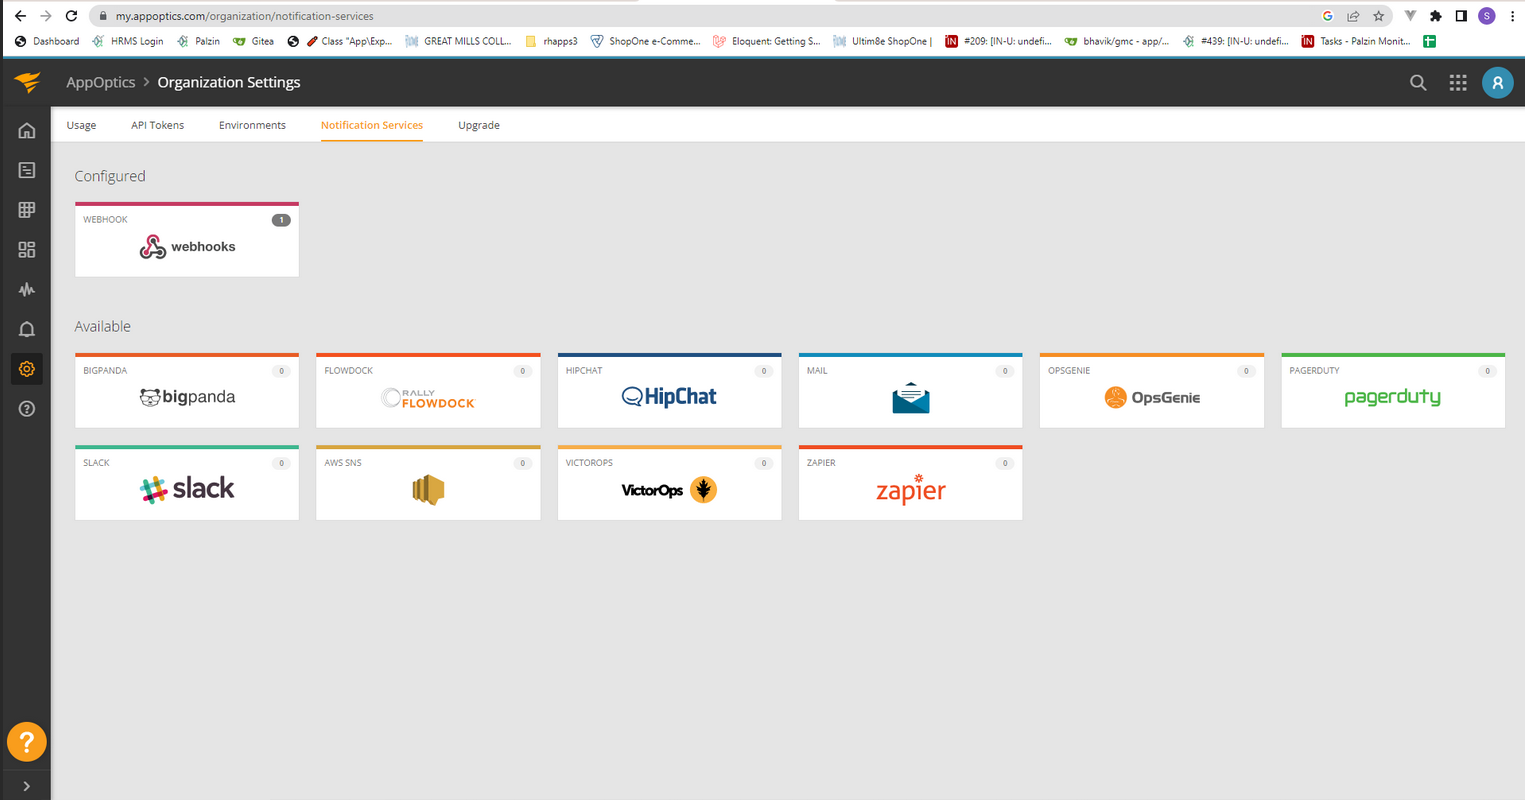
From the dashboard navigate to organization settings and then go to notification services.
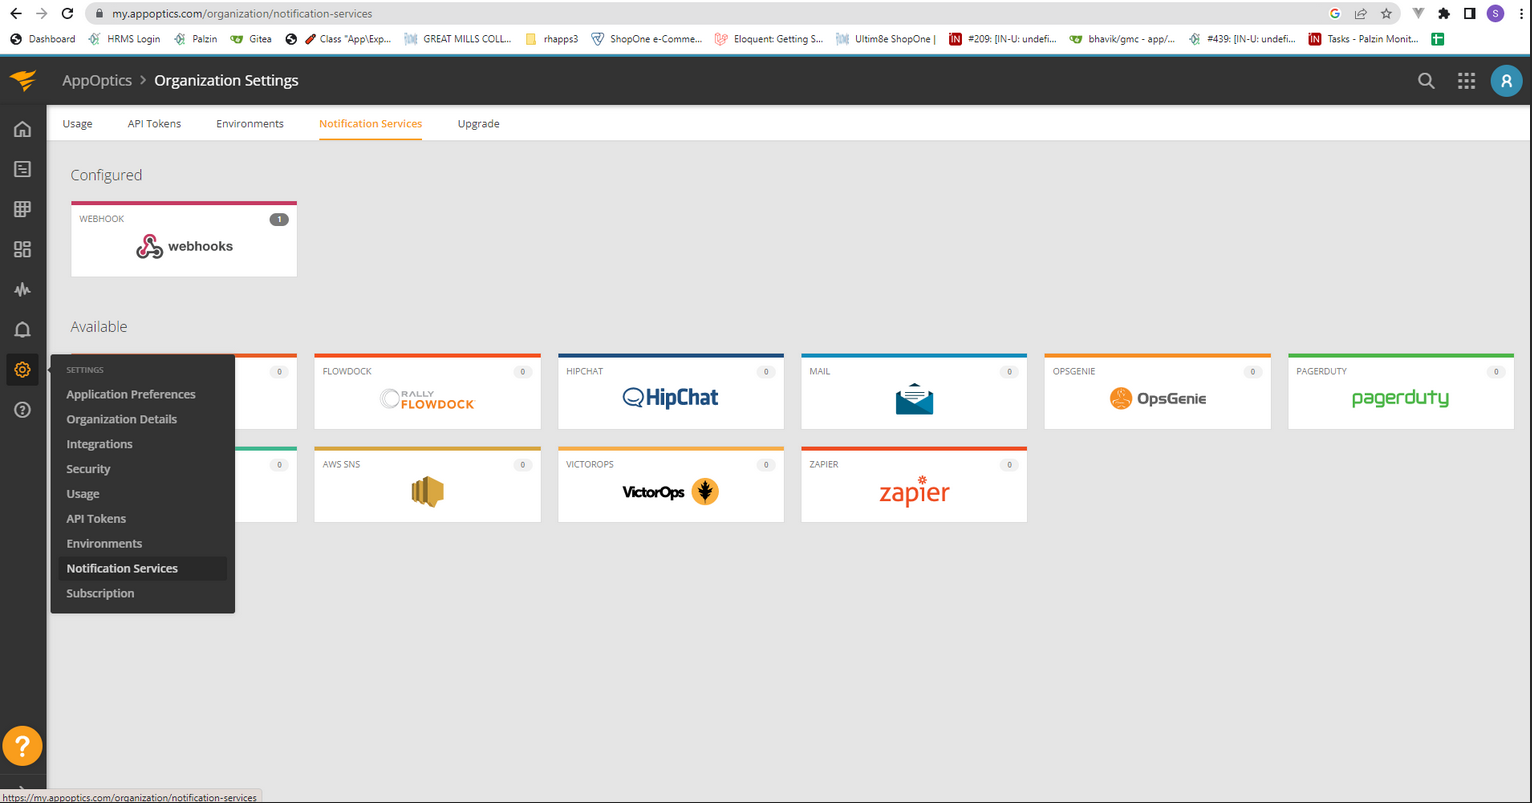
Select webhooks from the available integrations.
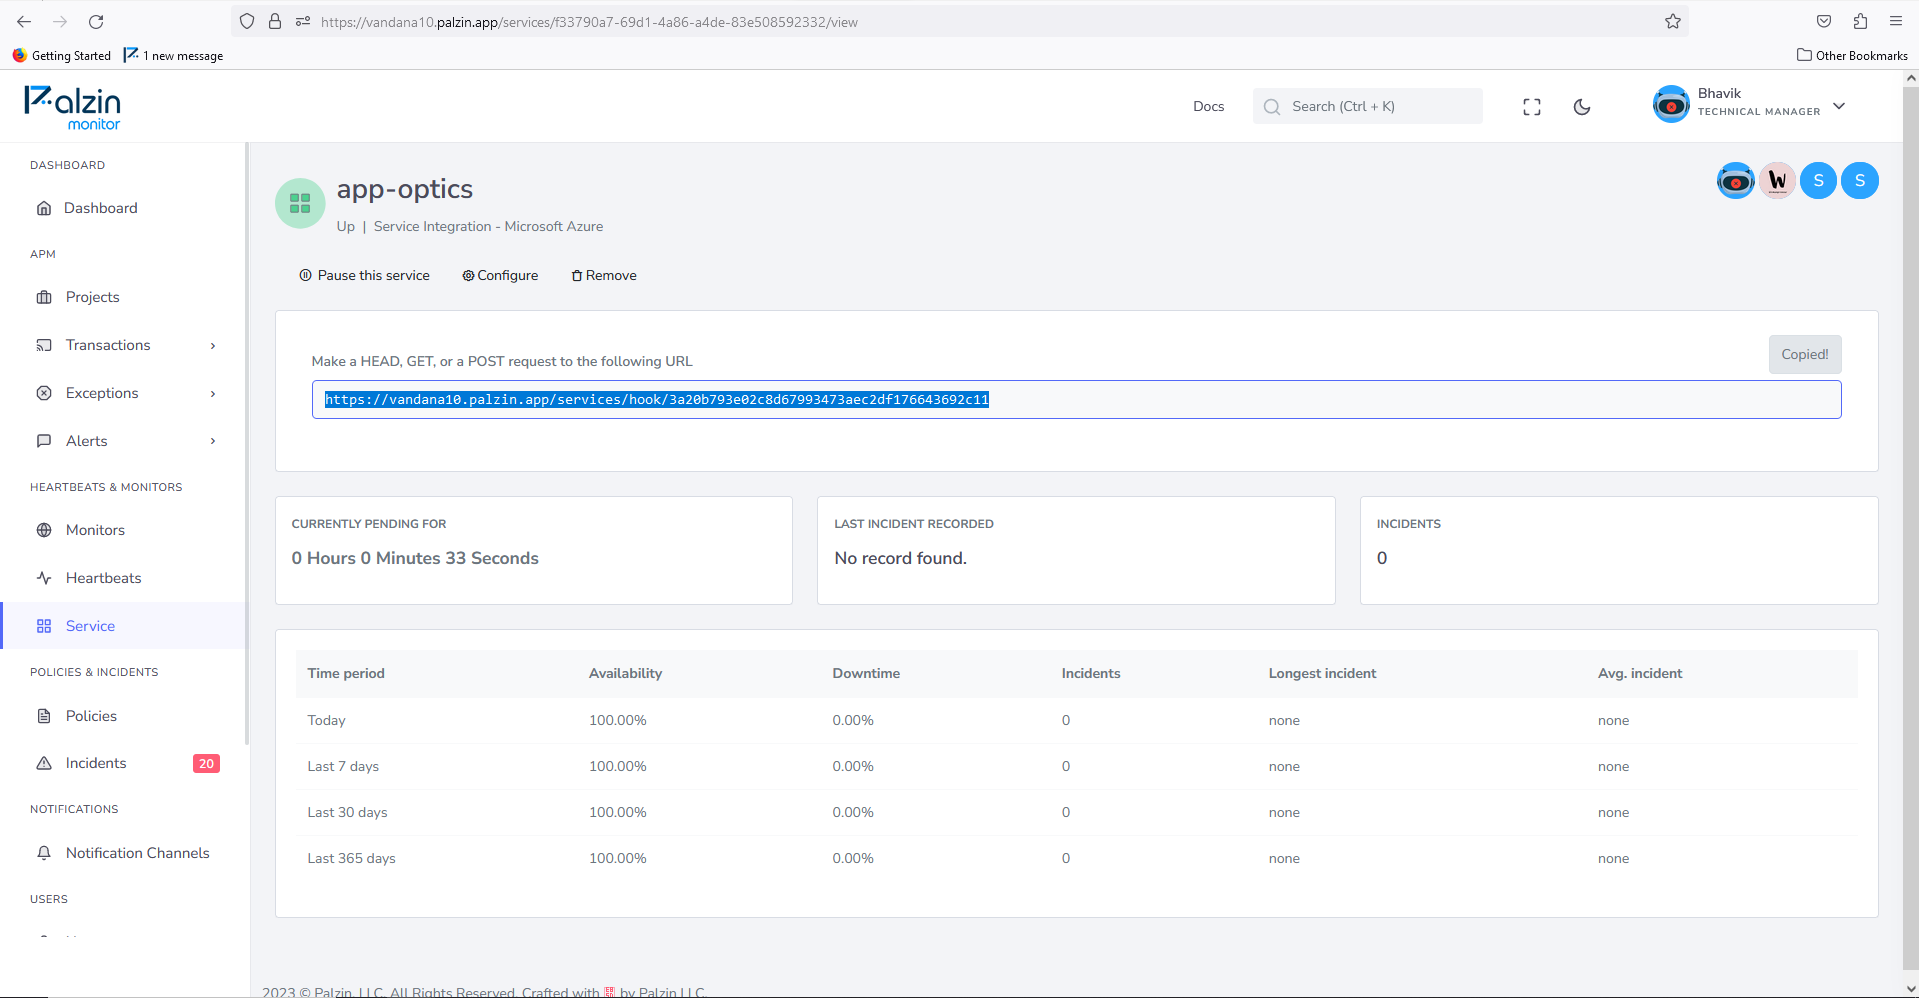
Copy URL from your palzin instance service view page.
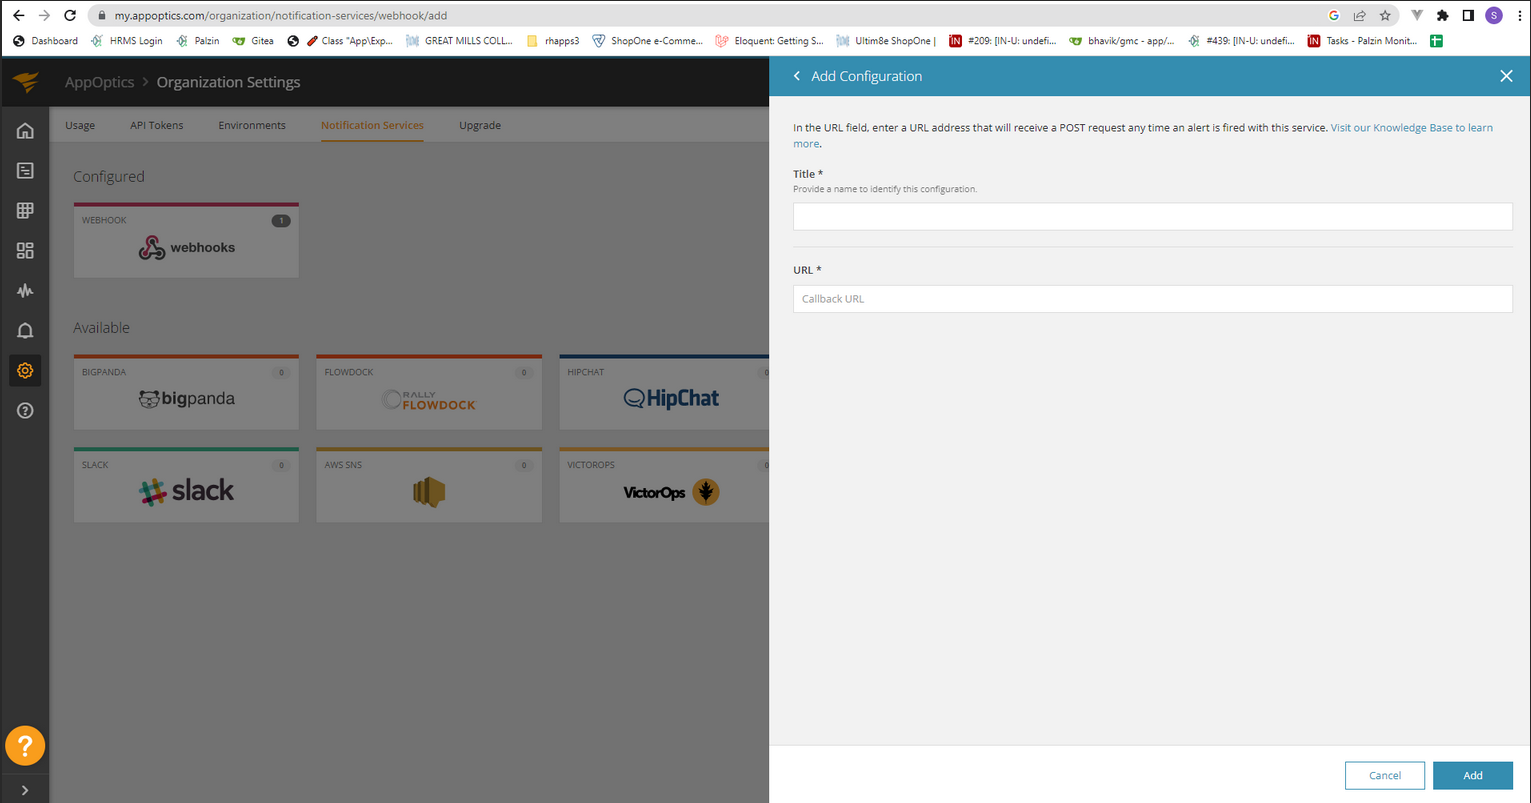
Paste the Palzin Monitor webhook URL and Add.
In your palzin instance, an incident will be created. That will contain these details.
{
    "alert": {
        "id": 1324235,
        "name": "collectd.high.load",
        "runbook_url": "http://example.com/runbook.pdf",
        "version": 2
    },
    "incident_key": "<key that uniquely identifies this alert incident>",
    "account": "m@example.com",
    "trigger_time": 144432177459,
    "conditions": [
        {
            "id": 1150312670,
            "type": "above",
            "threshold": 2,
            "duration": 300
        }
    ],
    "violations": {
        "example-ubuntu-14.04": [
            {
                "metric": "collectd.load.load.shortterm",
                "value": 7.190000031572205,
                "recorded_at": 1444312177454,
                "condition_violated": 1153120670,
                "count": 31,
                "begin": 1444312177140,
                "end": 1444131277440
            }
        ]
    }
}
It takes less than a minutes to setup your first monitoring.


